")
")
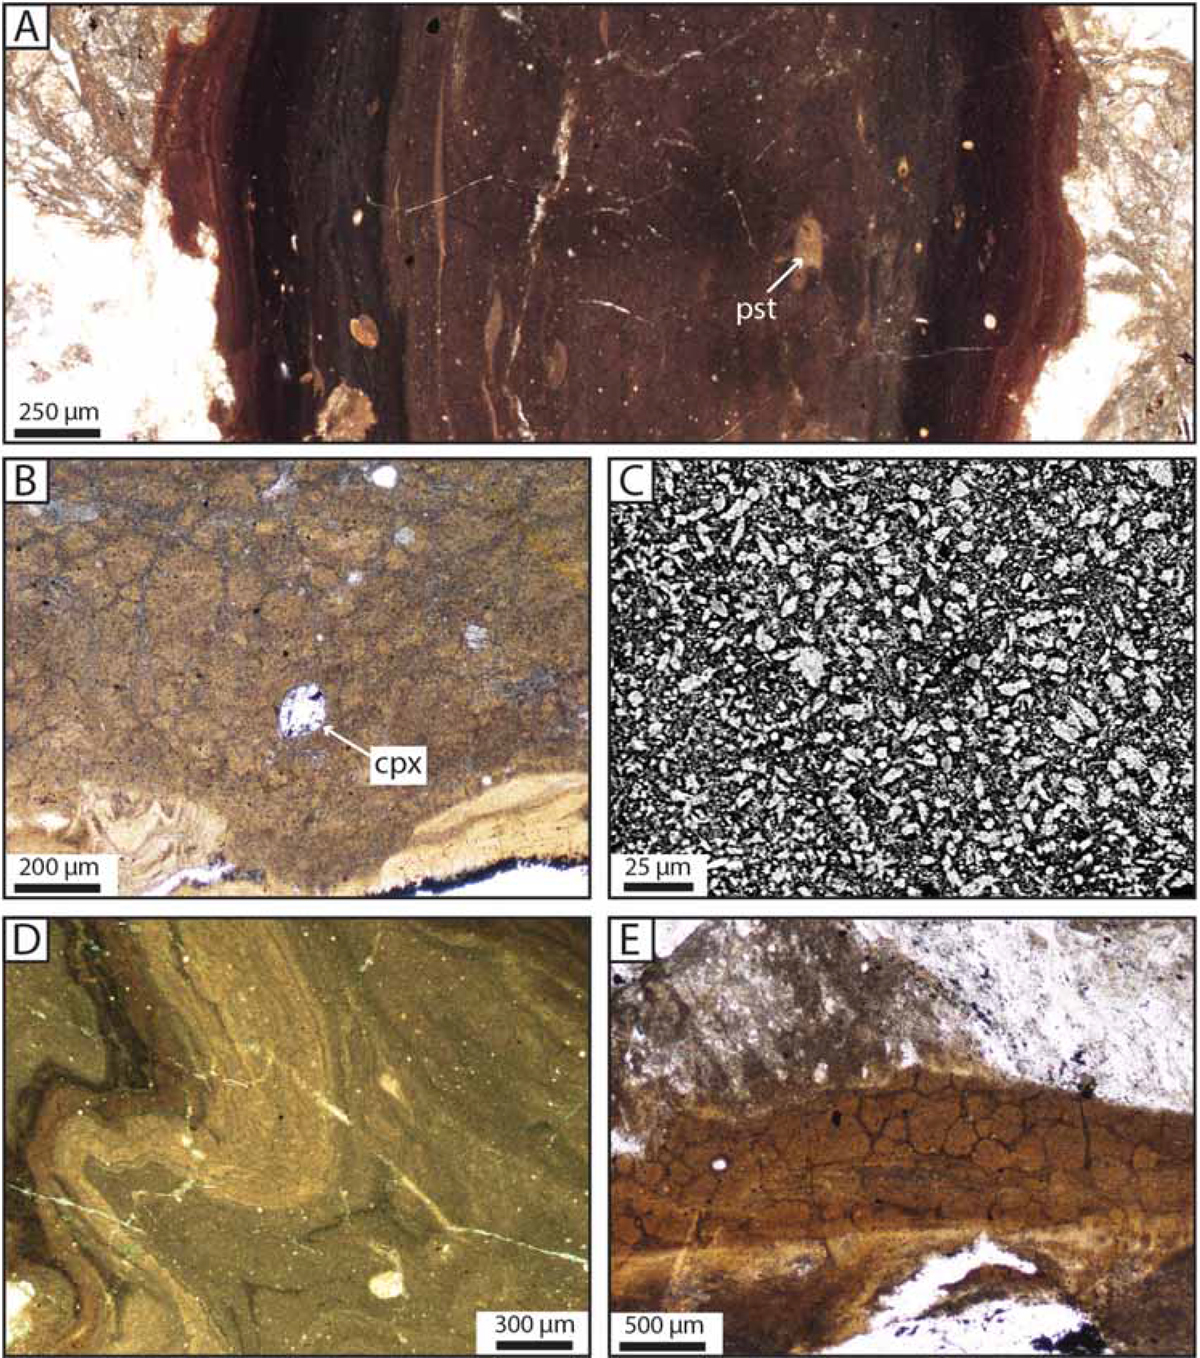
Fig. 7
Download original image
Photomicrographs of pseudotachylyte veins. A. Injection vein showing zonation parallel to boundaries with flow banding (outlined by aligned clasts) and with chilled margins (locality 1). The darker outer sides correspond to chilled margins. Note the presence of pseudotachylyte clasts indicating a polyphase seismic activity. B. Well-rounded clinopyroxene clast (cpx) embedded in a fault vein (locality 1). C. Scanning electron microscope image of olivine and pyroxene microlites in a fault vein (locality 1). D. Flow fold frozen in an injection vein (locality 2). E. Cryptocrystalline matrix of a fault vein pseudotachylyte showing polygonal cracks interpreted as devitrification textures (locality 2).
Current usage metrics show cumulative count of Article Views (full-text article views including HTML views, PDF and ePub downloads, according to the available data) and Abstracts Views on Vision4Press platform.
Data correspond to usage on the plateform after 2015. The current usage metrics is available 48-96 hours after online publication and is updated daily on week days.
Initial download of the metrics may take a while.