")
")
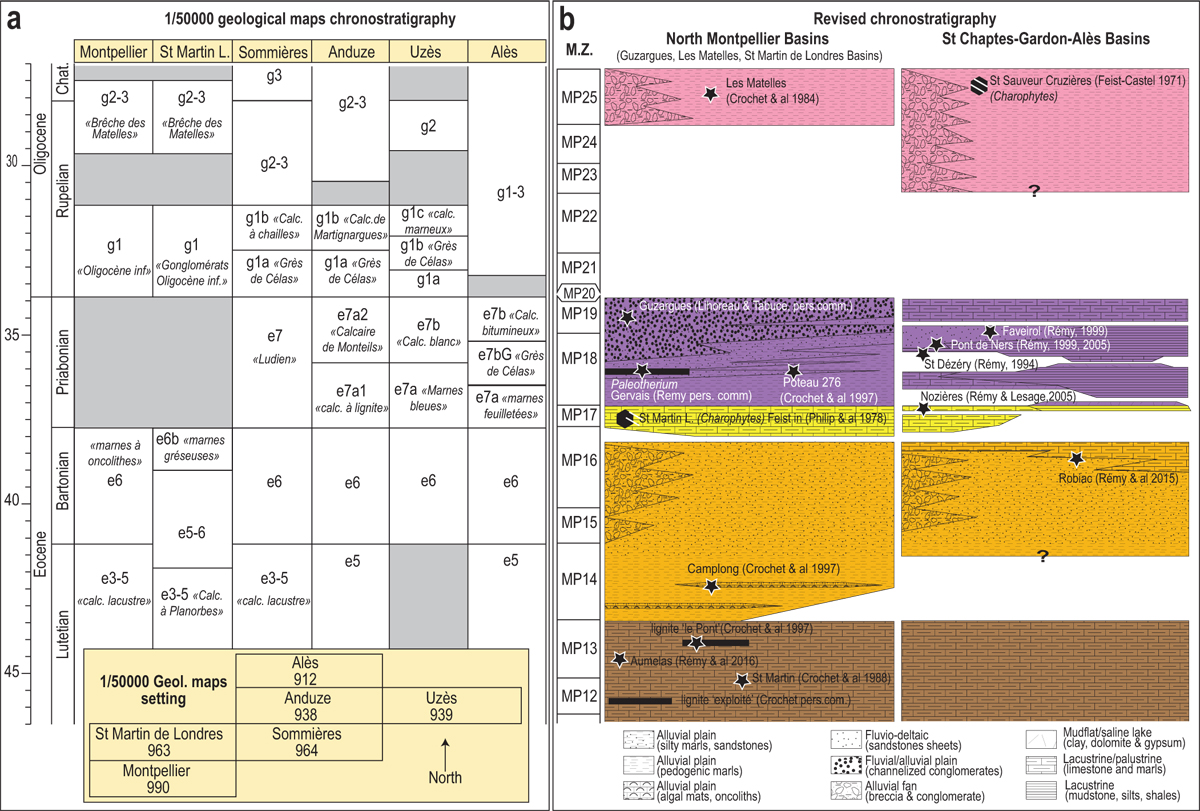
Fig. 3
Download original image
a: Correlation chart of the Eocene to Oligocene interval, and inferred ages, according to the BRGM 1/50 000-scale geological maps of the study area. The inset in the lower part gives the position of the BRGM 1/50 000-scale geological maps. b: Revised chronostratigraphy of the basins north of Montpellier (covered by the geological maps of Montpellier, St Martin-de-Londres and part of Sommières and Anduze) and of the Saint-Chaptes-Gardon basins (maps of Alès and part of Anduze and Uzès). This is based on new mapping of the Paleogene basins (this study) and on the compilation of biostratigraphy data, including recent discoveries of mammal fossils (references in the figure and in the text). Biostratigraphy scale according to mammal reference levels (M.Z.). Black stars and black hexagons correspond to mammal and charophyte sites, respectively. Simplified lithology of the formations is indicated. Colour code as in the following maps and sections of the Paleogene basins analysed in this study. White areas correspond to non-depositional and erosional hiatuses; the Priabonian interval from Saint-Chaptes-Gardon-Alès basins is documented in Lettéron et al. (2018).
Current usage metrics show cumulative count of Article Views (full-text article views including HTML views, PDF and ePub downloads, according to the available data) and Abstracts Views on Vision4Press platform.
Data correspond to usage on the plateform after 2015. The current usage metrics is available 48-96 hours after online publication and is updated daily on week days.
Initial download of the metrics may take a while.