")
")
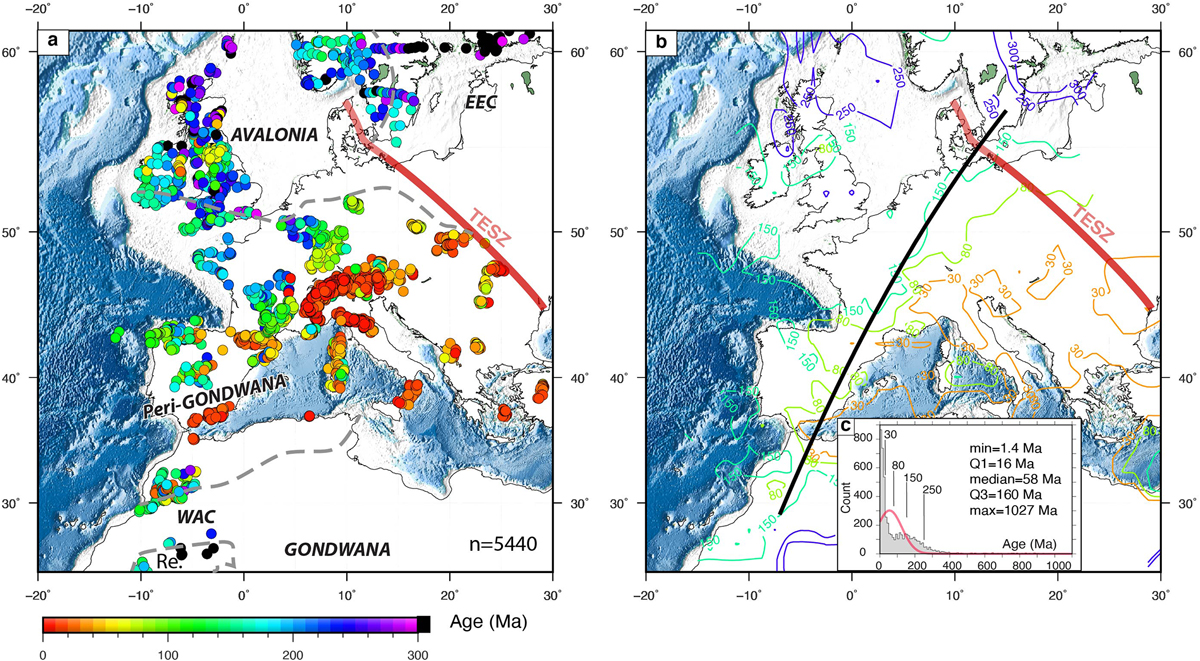
Fig. 14
Download original image
Distribution of apatite fission-track (AFT) cooling ages in Western Europe and northern Africa (a) based on a compilation of 5440 analyses (see Repository). Colored contour lines of AFT ages from the interpolation of individual dates in (a) based on 1000 km search radius. (c) Histogram with 10 Ma bins and Gaussian distribution (red) centered on the median with L1 scale of AFT age. (c) Minimum, quartiles Q1(25%) and Q3(75%), median and maximum of AFT data. Lines labeled 1 and 2 correspond to sections in Figure 15. TESZ: Trans-European Suture Zone.
Current usage metrics show cumulative count of Article Views (full-text article views including HTML views, PDF and ePub downloads, according to the available data) and Abstracts Views on Vision4Press platform.
Data correspond to usage on the plateform after 2015. The current usage metrics is available 48-96 hours after online publication and is updated daily on week days.
Initial download of the metrics may take a while.