")
")
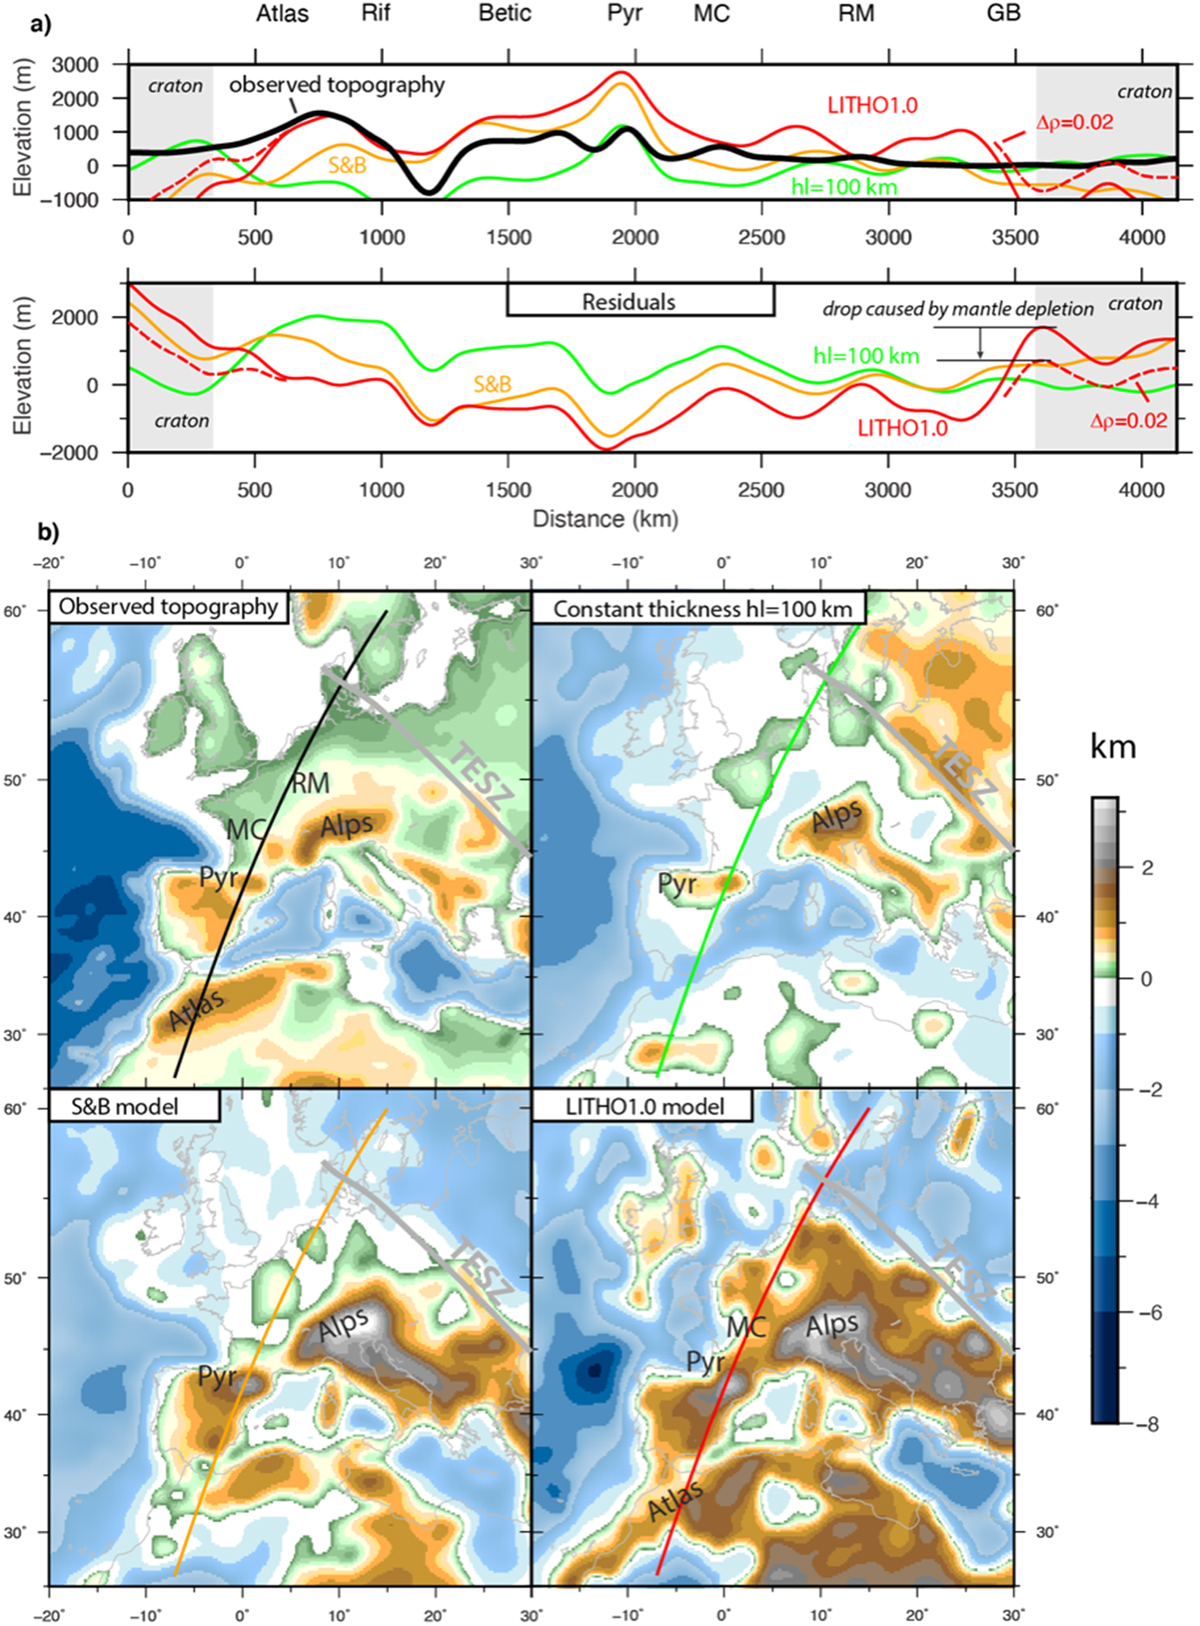
Fig. 5
Download original image
Predicted topography for different lithosphere thickness models. (a) Profiles of predicted (top) and residuals (below) for constant lithosphere thickness of 100 km (green), lithosphere thickness model S&B (orange) after (Steinberger and Becker, 2016), and lithosphere thickness model LITHO1.0 (red) after (Pasyanos et al., 2014). Red dashed line refers to the case in which the lithosphere density has been reduced by 0.02 kg/m3 below cratons hence leading to drastic diminution of the topographic residuals in regions with thick lithosphere. (b) Maps depicting the predicted topography of Western Europe for each models in (a) and location of profiles (see text for explanation). Topography, LAB, crustal thickness and densities have been smoothed using gaussian filtering with a filter width of 300 km.
Current usage metrics show cumulative count of Article Views (full-text article views including HTML views, PDF and ePub downloads, according to the available data) and Abstracts Views on Vision4Press platform.
Data correspond to usage on the plateform after 2015. The current usage metrics is available 48-96 hours after online publication and is updated daily on week days.
Initial download of the metrics may take a while.