")
")
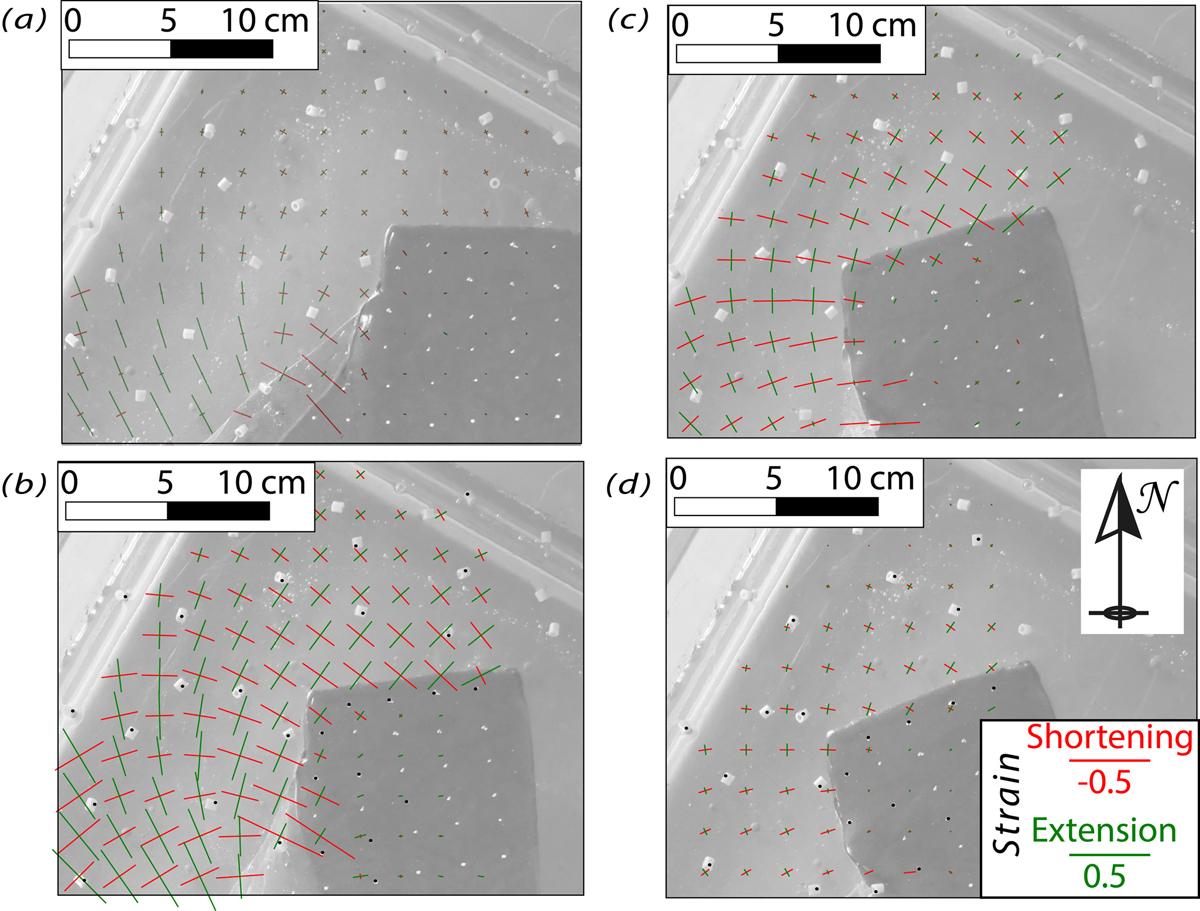
Fig. 4
Download original image
Deformations of the surface of Model 1: the principal axes of the strain tensor are reported. Green and red lines indicate extension and shortening, respectively. Strain tensors have calculated between (a) 50 and 150 s; (b) 200 and 300 s; (c) 350 and 450 s; (d) 500 and 600 s of experiment. After 600 s, slabs are almost vertical and deformation is very slow.
Current usage metrics show cumulative count of Article Views (full-text article views including HTML views, PDF and ePub downloads, according to the available data) and Abstracts Views on Vision4Press platform.
Data correspond to usage on the plateform after 2015. The current usage metrics is available 48-96 hours after online publication and is updated daily on week days.
Initial download of the metrics may take a while.