")
")
Fig. 3
Download original image
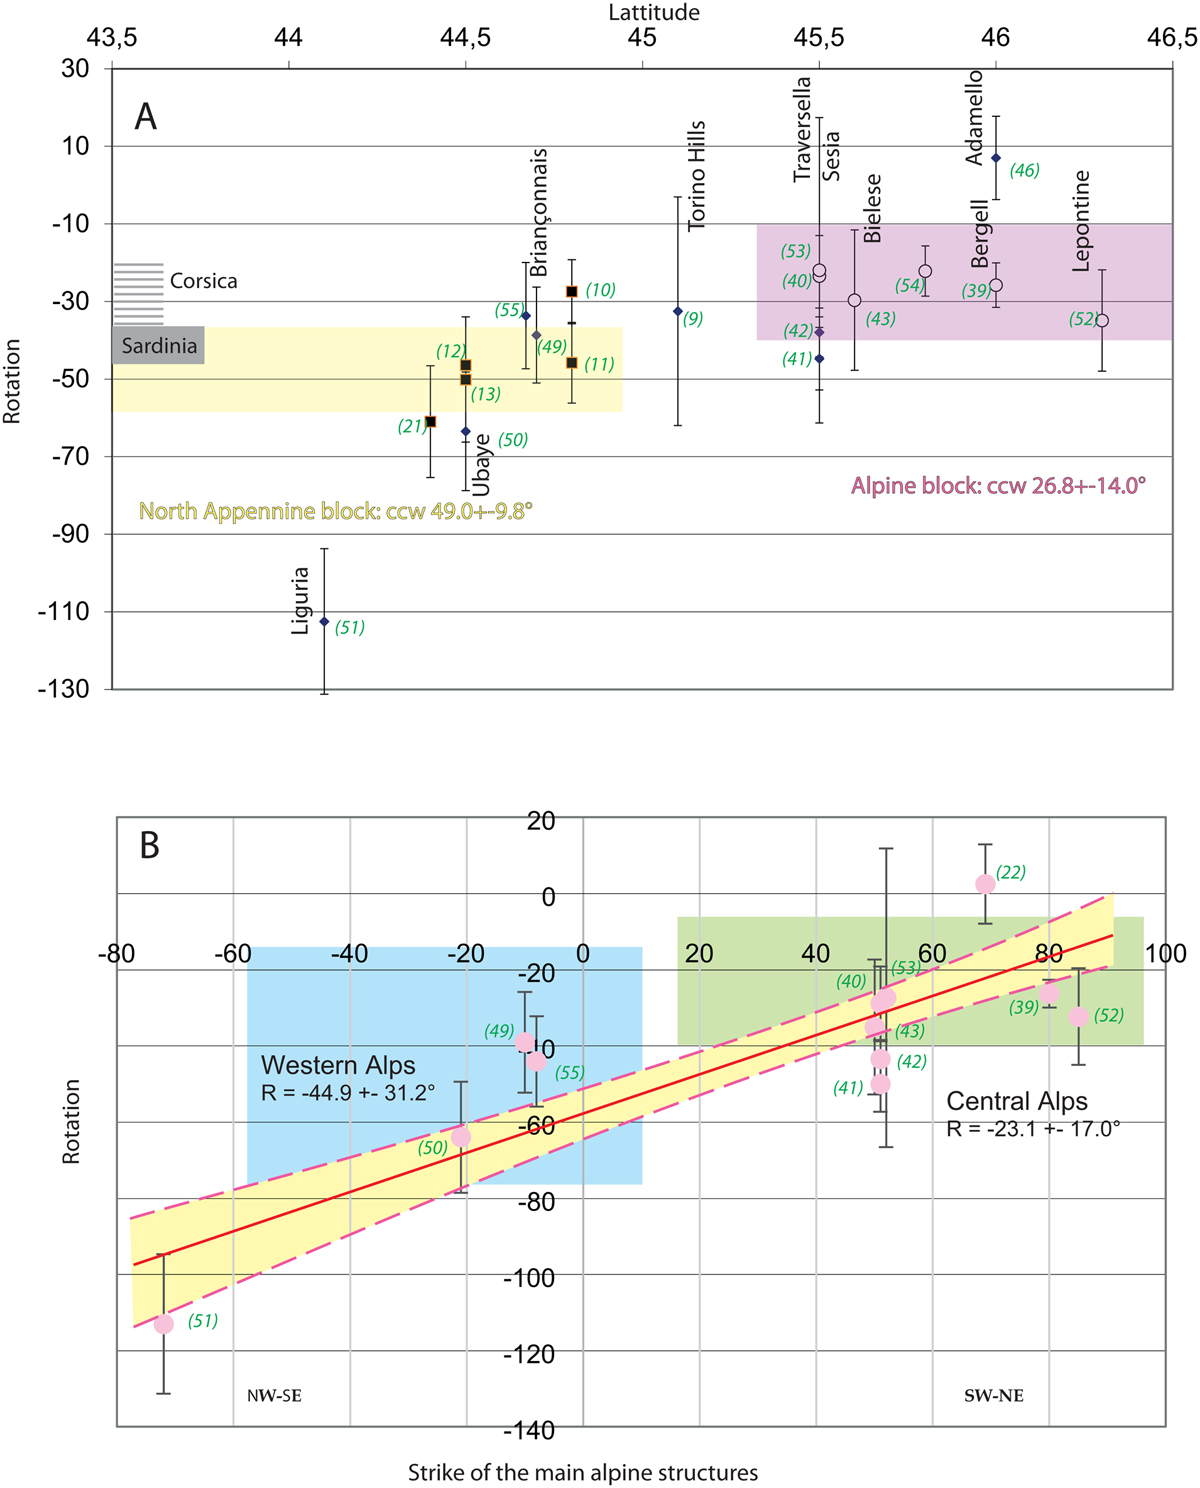
A- Rotation versus latitude for the Internal zones and Piemont area; Full square: data used for calculation of “N Apennine block” rotation. Open circle: data used for calculation of “Alpine block” rotation. Amount of rotation for Corsica and Sardinia is graphically indicated on the left of the graph. B- Oroclinal test (rotation versus strike of the main alpine structures) for the Internal zones. The red line shows the total least squares regression for the data. The surrounding shaded yellow area illustrates the confidence interval for 1000 bootstrapped regressions. Rotations of the Western Alps in blue (−44.9 ± 31.2°) and the Central Alps in green (−23.1 ± 17.0°) are indicated.
Current usage metrics show cumulative count of Article Views (full-text article views including HTML views, PDF and ePub downloads, according to the available data) and Abstracts Views on Vision4Press platform.
Data correspond to usage on the plateform after 2015. The current usage metrics is available 48-96 hours after online publication and is updated daily on week days.
Initial download of the metrics may take a while.