")
")
Fig. 18
Download original image
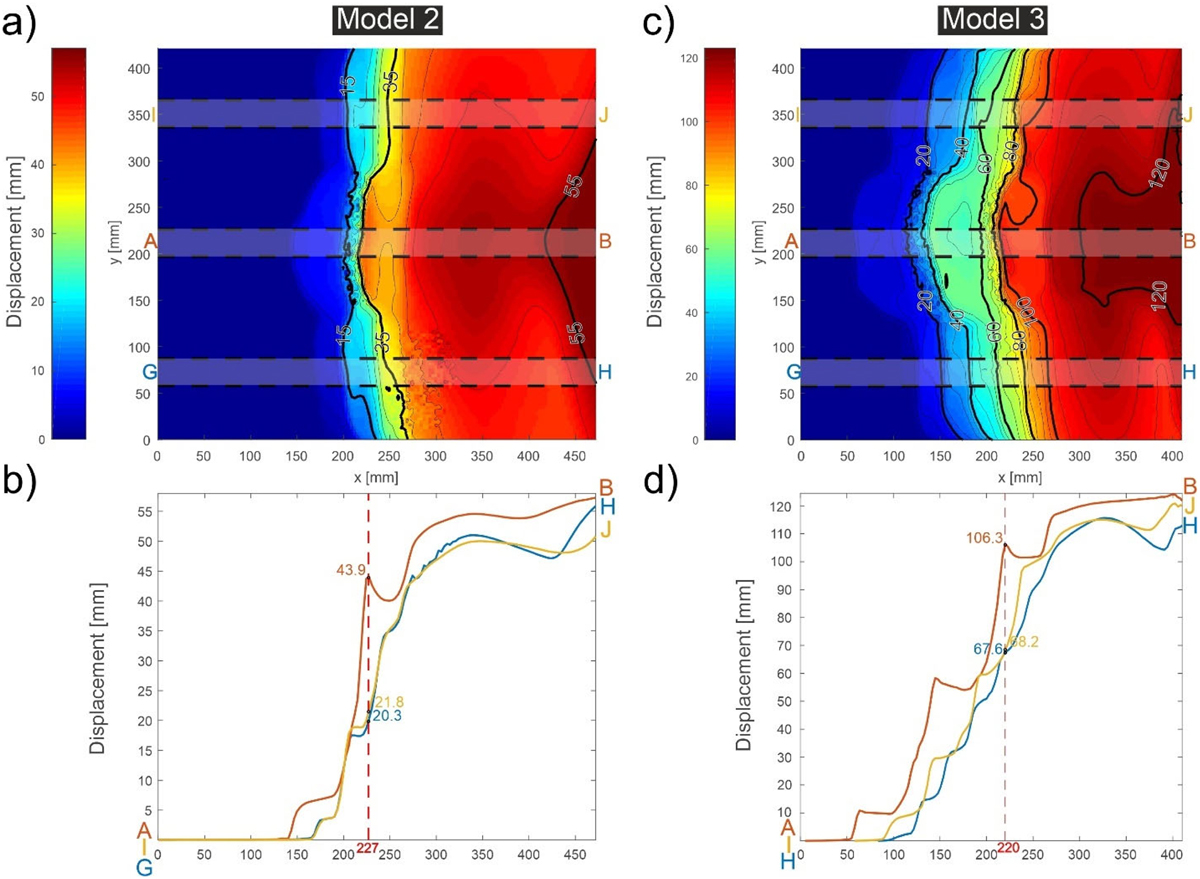
Final surface distribution of total horizontal displacement in the direction of shortening at the end of experiment 2 (a) and 3 (c). The total imposed displacement at the back wall is 57 and 123 mm, in experiments 2 and 3 respectively. Three mean displacement profiles for experiment 2 (b) and 3 (d) are averaged from the shaded regions labelled IJ, AB and GH in (a) and (c). Abscissae are counted in mm from the fixed front end of the box.
Distribution de la surface finale du déplacement horizontal total dans la direction du raccourcissement à la fin de l’expérience 2 (a) et 3 (c). La moyenne de trois profils de déplacement moyen pour les expériences 2 (b) et 3 (d) est calculée à partir des régions ombrées étiquetées IJ, AB et GH dans (a) et (c).
Current usage metrics show cumulative count of Article Views (full-text article views including HTML views, PDF and ePub downloads, according to the available data) and Abstracts Views on Vision4Press platform.
Data correspond to usage on the plateform after 2015. The current usage metrics is available 48-96 hours after online publication and is updated daily on week days.
Initial download of the metrics may take a while.