")
")
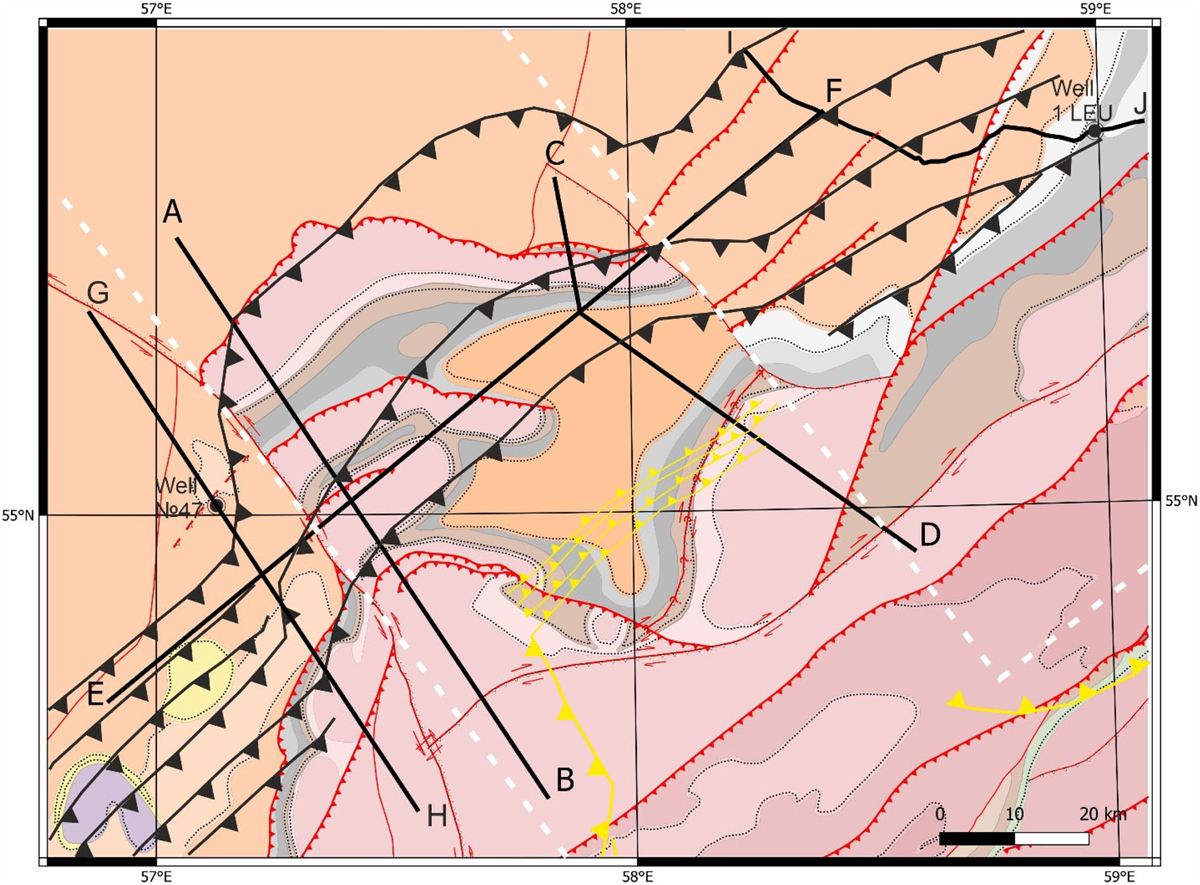
Fig. 20
Download original image
Superposition of the Karatau structural complex geological map (Fig. 8) and the interpretation of the final state of the experimental model 3 (Fig. 16c). Same legend as figures 8 and 16.
Superposition de la carte géologique du complexe structural de Karatau (Fig. 8) et de l’interprétation de l’état final du modèle expérimental 3 (Fig. 16c).
Current usage metrics show cumulative count of Article Views (full-text article views including HTML views, PDF and ePub downloads, according to the available data) and Abstracts Views on Vision4Press platform.
Data correspond to usage on the plateform after 2015. The current usage metrics is available 48-96 hours after online publication and is updated daily on week days.
Initial download of the metrics may take a while.