")
")
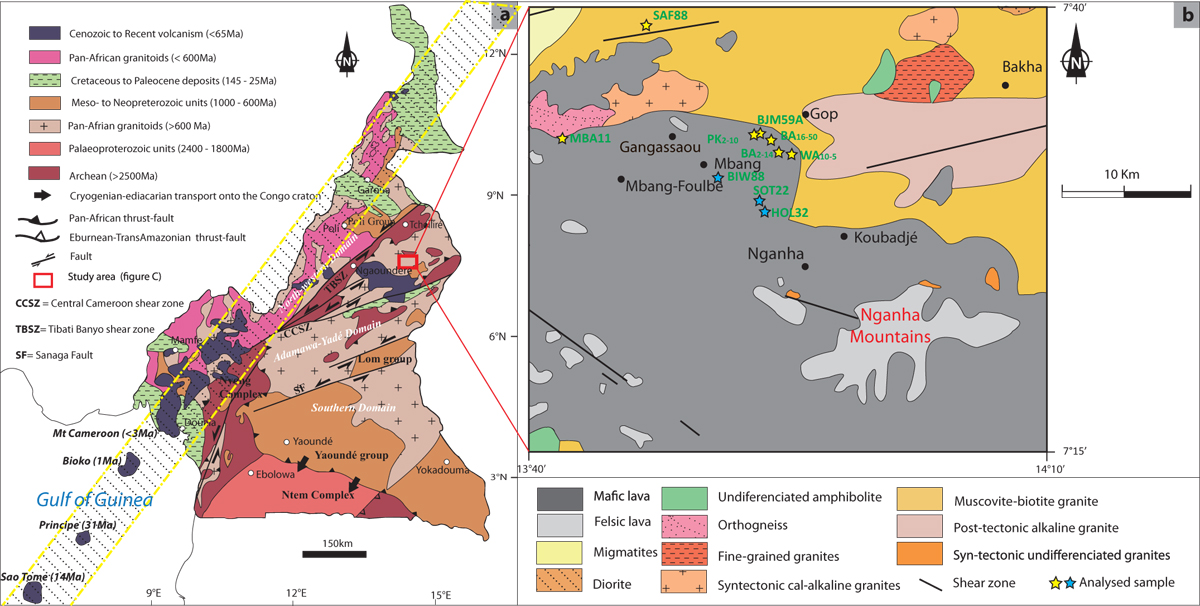
Fig. 1
Download original image
Location of the study area: (a) Geological sketch of Cameroon (modified after Ngako et al., 2003; Owona et al., 2013) with the position of the study area; (b) Simplified geological map of the study area (modified from Mbassa et al., 2025). The hatched band outlined by dashed yellow lines represents the CVL. The blue stars represent lava enclosing mantle xenoliths.
Current usage metrics show cumulative count of Article Views (full-text article views including HTML views, PDF and ePub downloads, according to the available data) and Abstracts Views on Vision4Press platform.
Data correspond to usage on the plateform after 2015. The current usage metrics is available 48-96 hours after online publication and is updated daily on week days.
Initial download of the metrics may take a while.