")
")
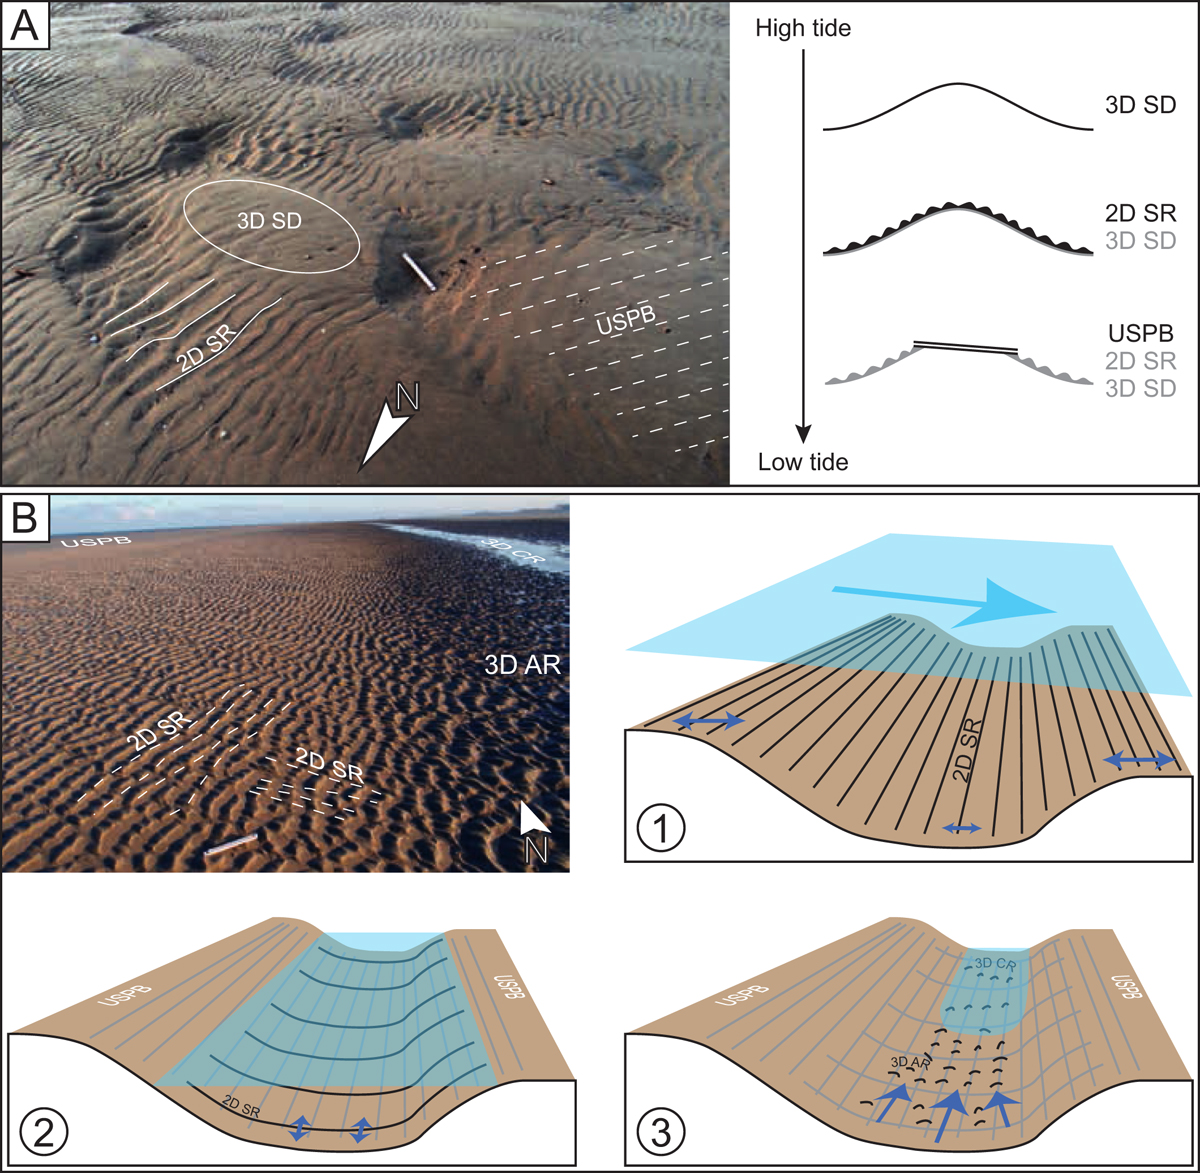
Fig. 5
Download original image
(A) Bedform succession observed close to the shoreline of highest tide. 2D SR are mainly observed within the troughs of the 3D SD, and the USPB replace the hummocky part of the 3D SD. The 3D SD are generated during high tide and then, during falling tide, 2D SR are generated. Sea level continuing to fall, swash process and backwash process form USPB, flattening the zone and preserving the 2D SD within the trough of the 3D SD. (B) Bedforms occurring within a runnel. USPB is present on the ridge (top left corner) while 2D SD are observed on the slope of the runnel and 3D AR are limited to the central part of the runnel. 3D CR are not shown on the picture but occur under the small, still submerged zone. 2D SR showing an orientation parallel to the runnel are considered to be formed during high tide (1). Sea-level falling, the ridge is close to be exposed and USPB are formed on the top of the ridges (2). When the ridge is fully exposed, the runnel still allows wave propagation but now orthogonally to the shoreline. This explains how 2D SR is with crest aligned E-W (2). In (3), water is close to its lowest level and, during this step unidirectional tide current has increased, thus generating 3D AR and then 3D CR (when oscillatory process ceases).
Current usage metrics show cumulative count of Article Views (full-text article views including HTML views, PDF and ePub downloads, according to the available data) and Abstracts Views on Vision4Press platform.
Data correspond to usage on the plateform after 2015. The current usage metrics is available 48-96 hours after online publication and is updated daily on week days.
Initial download of the metrics may take a while.