")
")
Open Access
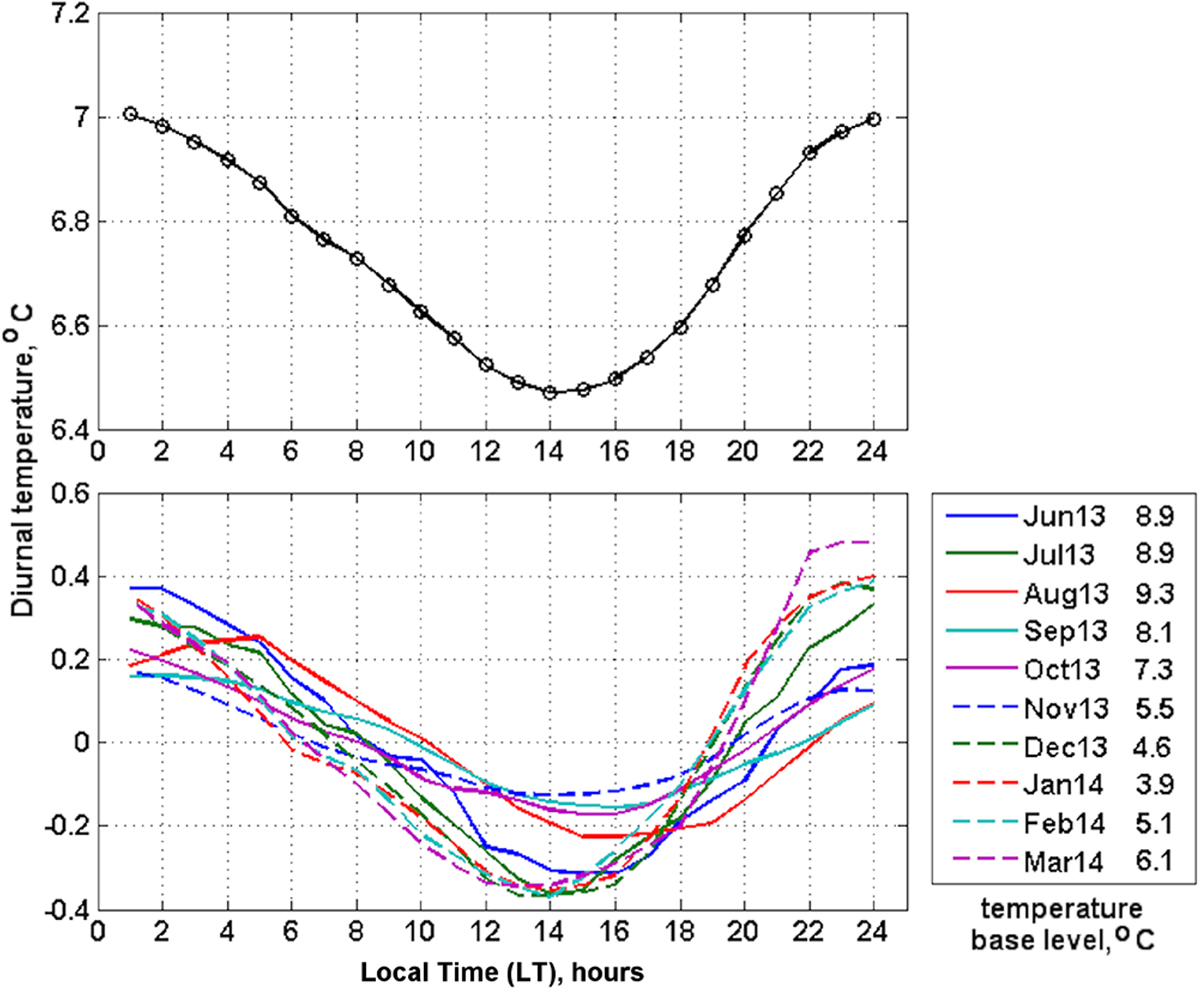
Fig. 3
Download original image
Top: Averaged diurnal temperature for the period Jun 2013–Mar 2014. Bottom: Averaged diurnal temperature, monthly curves. Temperature values are zero-padded (base level subtracted for a better comparison). Base level temperature for each month is presented in the legend.
Current usage metrics show cumulative count of Article Views (full-text article views including HTML views, PDF and ePub downloads, according to the available data) and Abstracts Views on Vision4Press platform.
Data correspond to usage on the plateform after 2015. The current usage metrics is available 48-96 hours after online publication and is updated daily on week days.
Initial download of the metrics may take a while.