Fig. 4

Download original image
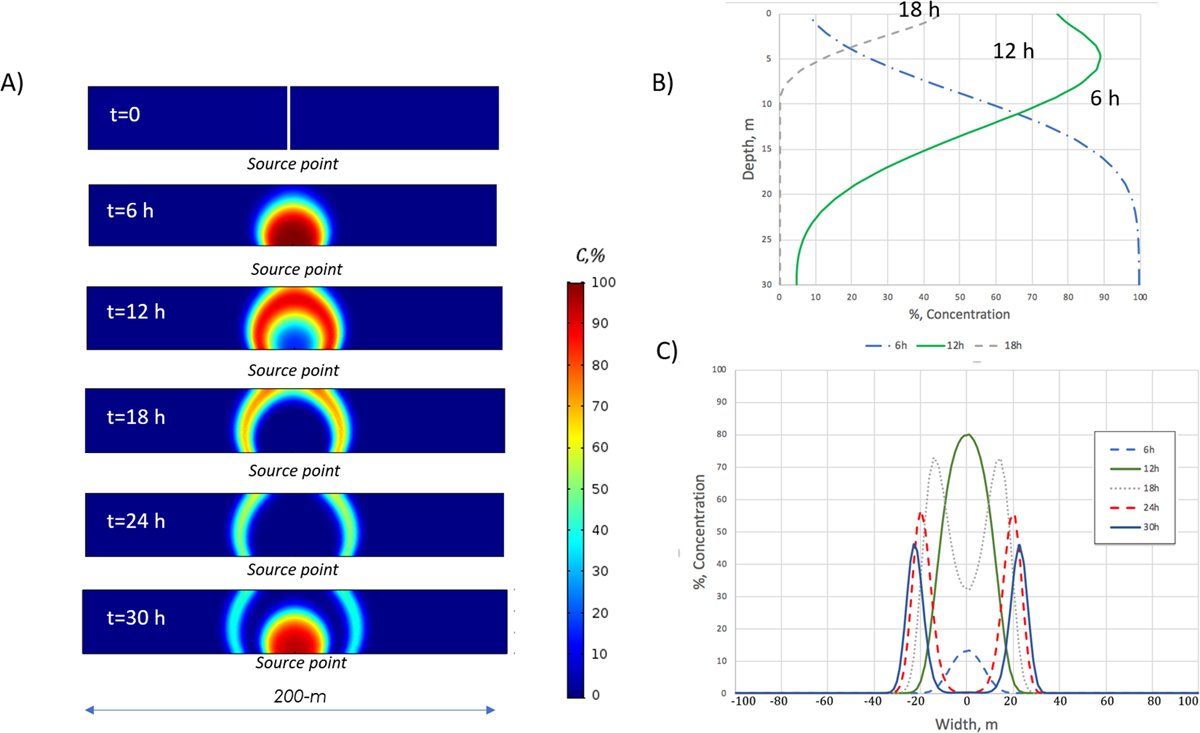
Pulse emission of H2 from the source at 30-m depth. A. Snapshots of an H2 gas pulse propagation in time. B. [H2%] distribution along a vertical line passing through the source point (see white line on the t = 0 snapshot of Fig. 4A). Note that the [H2] measured at a given depth will strongly vary over the pulse propagation cycle. C. [H2] distribution at 80-cm depth as a function of time. Reference case: no active bacteria, K = 10 Da, surplus in gas pressure at source is 2 bar, Depth of source = 30 m.
Current usage metrics show cumulative count of Article Views (full-text article views including HTML views, PDF and ePub downloads, according to the available data) and Abstracts Views on Vision4Press platform.
Data correspond to usage on the plateform after 2015. The current usage metrics is available 48-96 hours after online publication and is updated daily on week days.
Initial download of the metrics may take a while.


