")
")
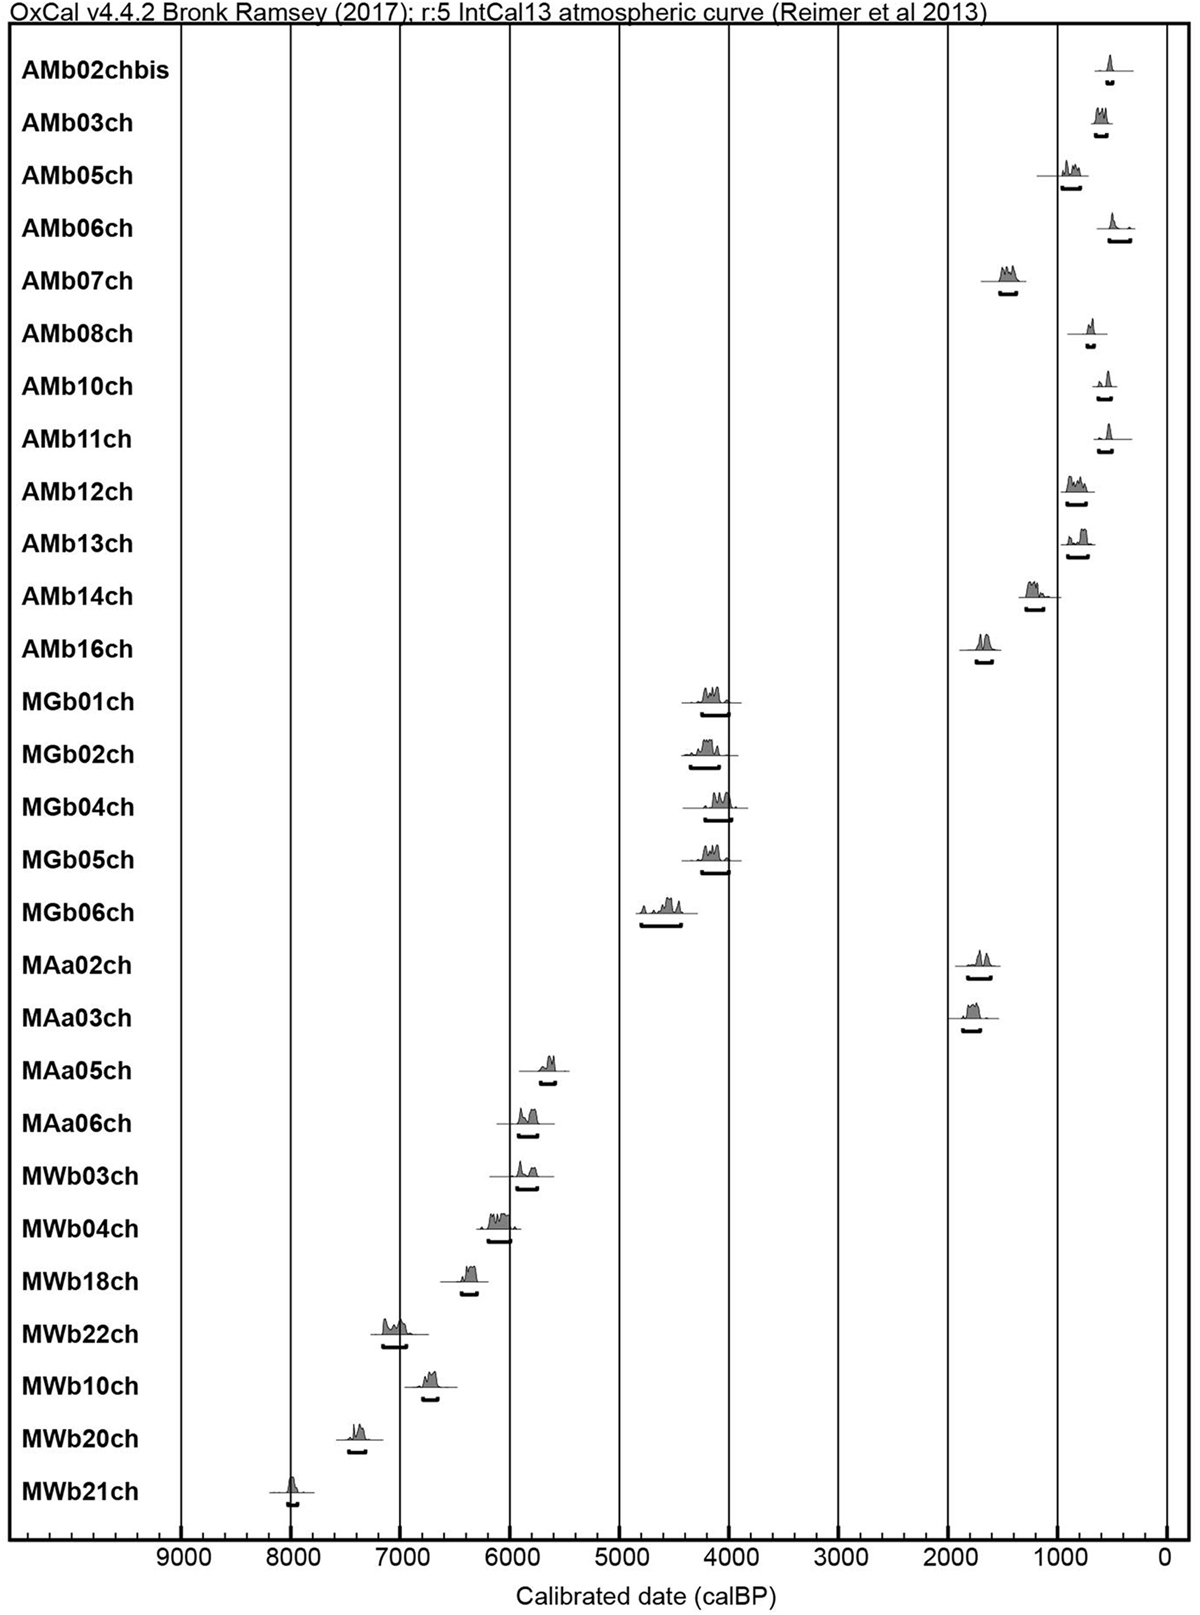
Fig. 16
Download original image
Synthetic presentation of all dated samples in the study. Plotted with OxCal v.4.3.2 (Bronk Ramsey, 2017) and calibration curve by Reimer et al. (2013).
Présentation synthétique de tous les échantillons datés de cette étude. Représentation avec OxCal v.4.3.2 (Bronk Ramsey, 2017) et courbe de calibration de Reimer et al. (2013).
Current usage metrics show cumulative count of Article Views (full-text article views including HTML views, PDF and ePub downloads, according to the available data) and Abstracts Views on Vision4Press platform.
Data correspond to usage on the plateform after 2015. The current usage metrics is available 48-96 hours after online publication and is updated daily on week days.
Initial download of the metrics may take a while.