")
")
Fig. 7
Download original image
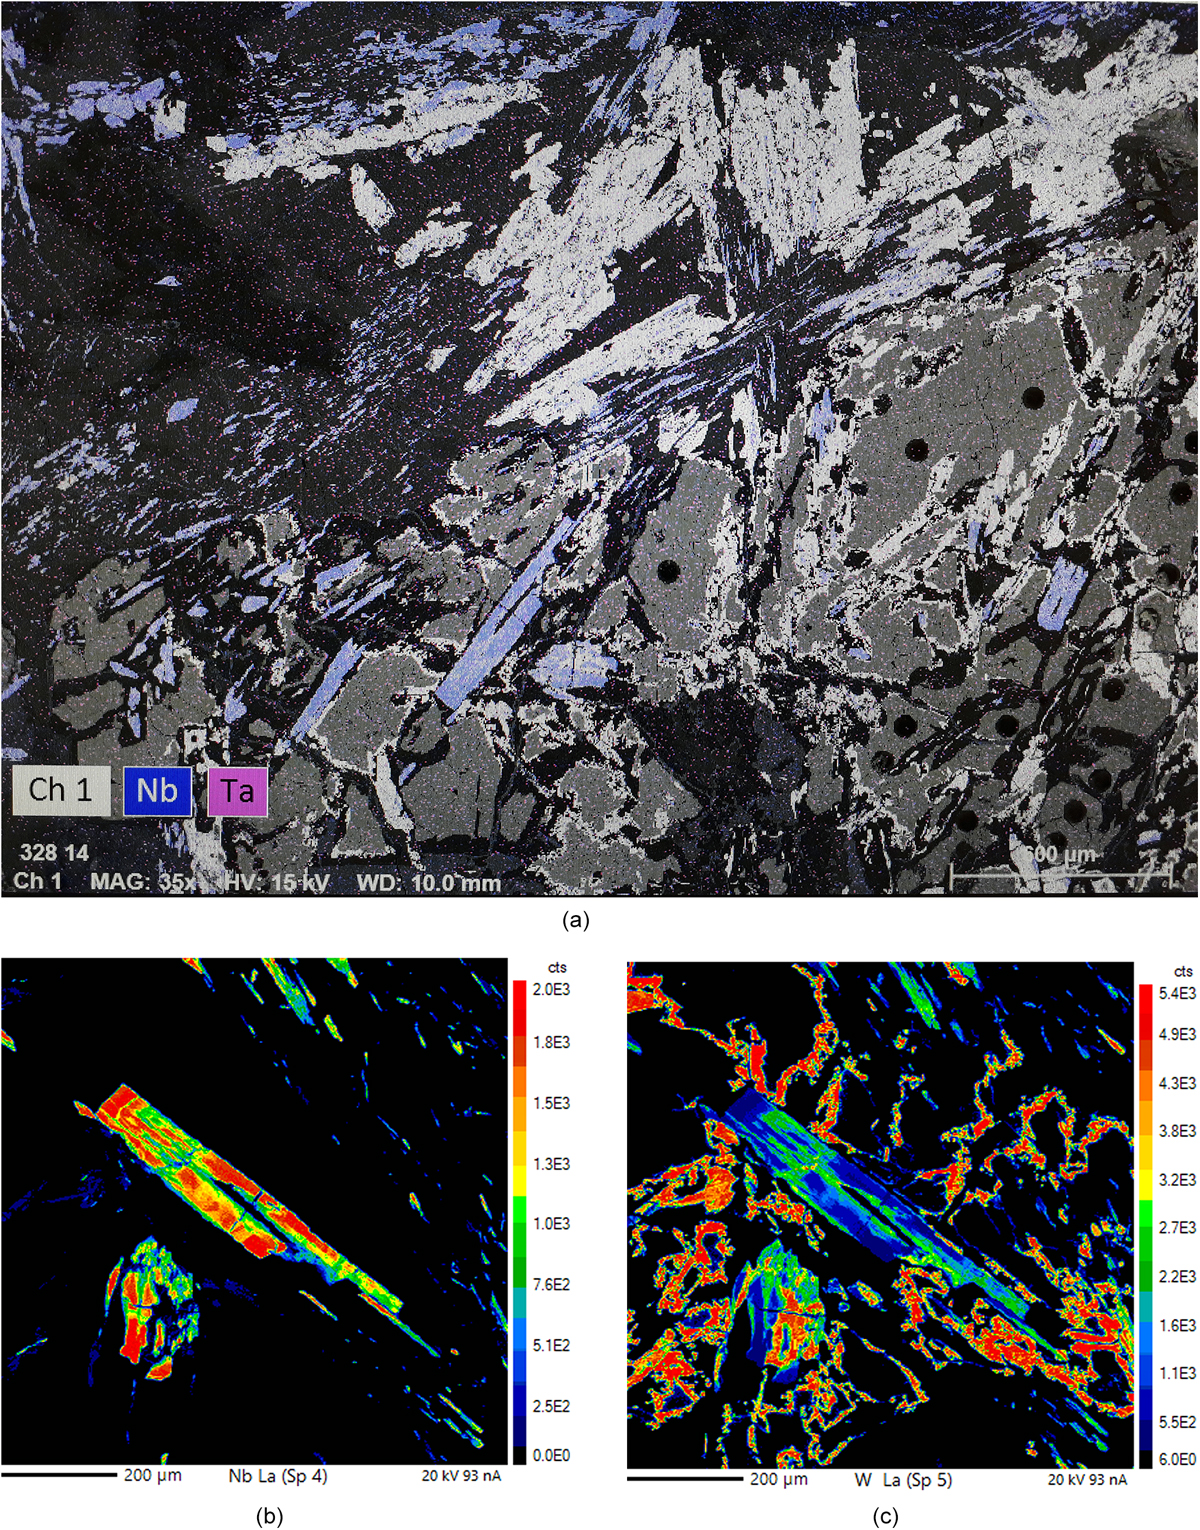
Habitus de la qitianlingite. (a) Cartographie élémentaire au MEB montrant les cristaux mixtes de qitianlingite-manganocolumbite (violets), wolframite (blanc-gris) et scheelite (gris sombre avec les impacts de laser pour datation ICPMS) ; (b) Cartographie élémentaire au MEB du grand cristal de qitianlingite-manganocolumbite visible sur (a) et montrant la répartition du niobium. Les zones riches en Nb (rouge à jaune) correspondent à la manganocolumbite, les zones pauvres (bleu et vert) à la qitianlingite ; (c) Idem (b), montrant la répartition du tungstène. Les zones enrichies en W (vert) correspondent à la qitianlingite, les zones appauvries et dépourvues de W (bleu à violacé) à la manganocolumbite. Les zones très riches, rouges et orangées, sont de la wolframite.
Qitianlingite habits. (a) MEB mapping (BSE) showing mixed crystals of qitianlingite-manganocolumbite (purple), wolframite (grey-white) and scheelite (dark grey with ICPMS laser impacts); (b) MEB mapping (BSE) made on the huge qitianlingite-manganocolumbite mixed crystal visible on (a) and showing niobium distribution. Nb-rich zones (red to yellow) is manganocolumbite, Nb-depleted zones (blue and green) is qitianlingite; (c) Idem (b), showing tungsten distribution. W-rich zones (green) is qitianlingite, W-depleted zones (blue to purplish) is manganocolumbite. Very-rich zones (red and orange) are wolframite.
Current usage metrics show cumulative count of Article Views (full-text article views including HTML views, PDF and ePub downloads, according to the available data) and Abstracts Views on Vision4Press platform.
Data correspond to usage on the plateform after 2015. The current usage metrics is available 48-96 hours after online publication and is updated daily on week days.
Initial download of the metrics may take a while.