")
")
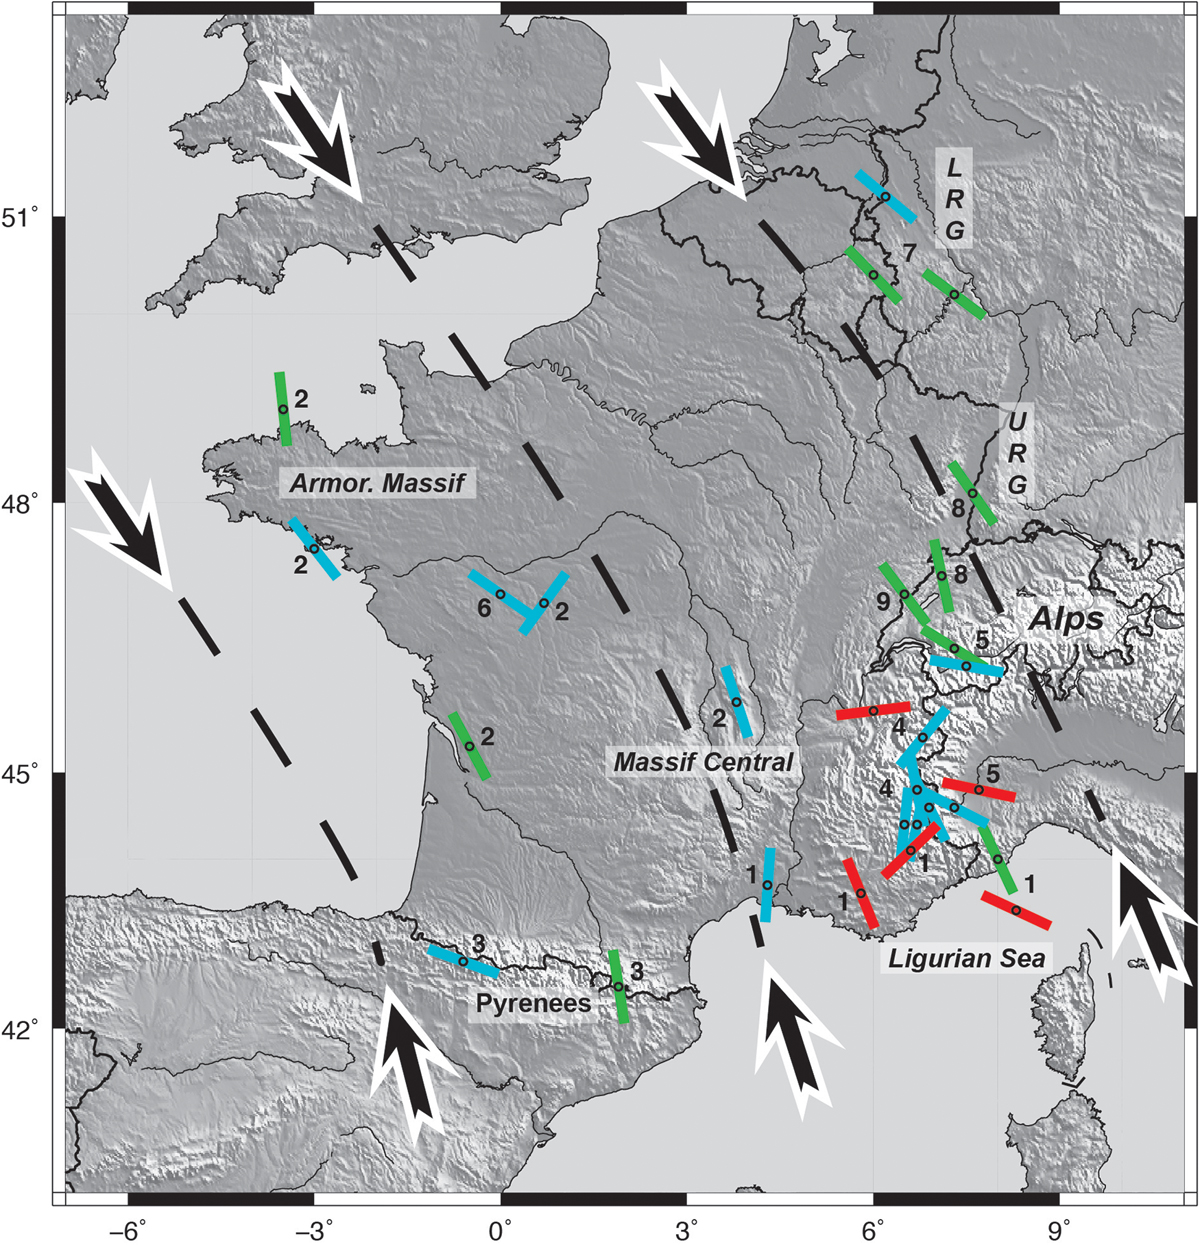
Fig. 1
Download original image
Schematic state of stress in France from published focal mechanism inversions. Thick dashed lines with inward-pointing arrows indicate the general direction of maximum horizontal compressive stress for Western Europe (e.g., Heidbach et al., 2018). Small bars show the orientations of maximum horizontal compressive stress from published regional focal mechanism inversions, with the deformation regime indicated in color: green = strike slip, blue = extension, red = shortening. Numbers indicate the reference for the nearest stress indicator: 1 – Baroux et al. (2001); 2 – Mazabraud et al. (2005); 3 – Rigo et al. (2015); 4 – Sue et al., (1999); 5 – Eva et al. (1997); 6 – Delouis et al. (1993); 7 – Hinzen (2003); 8 – Plenefisch and Bonjer (1997); 9 – Rabin et al. (2018). URG and LRG: Upper and Lower Rhine Graben.
Current usage metrics show cumulative count of Article Views (full-text article views including HTML views, PDF and ePub downloads, according to the available data) and Abstracts Views on Vision4Press platform.
Data correspond to usage on the plateform after 2015. The current usage metrics is available 48-96 hours after online publication and is updated daily on week days.
Initial download of the metrics may take a while.