")
")
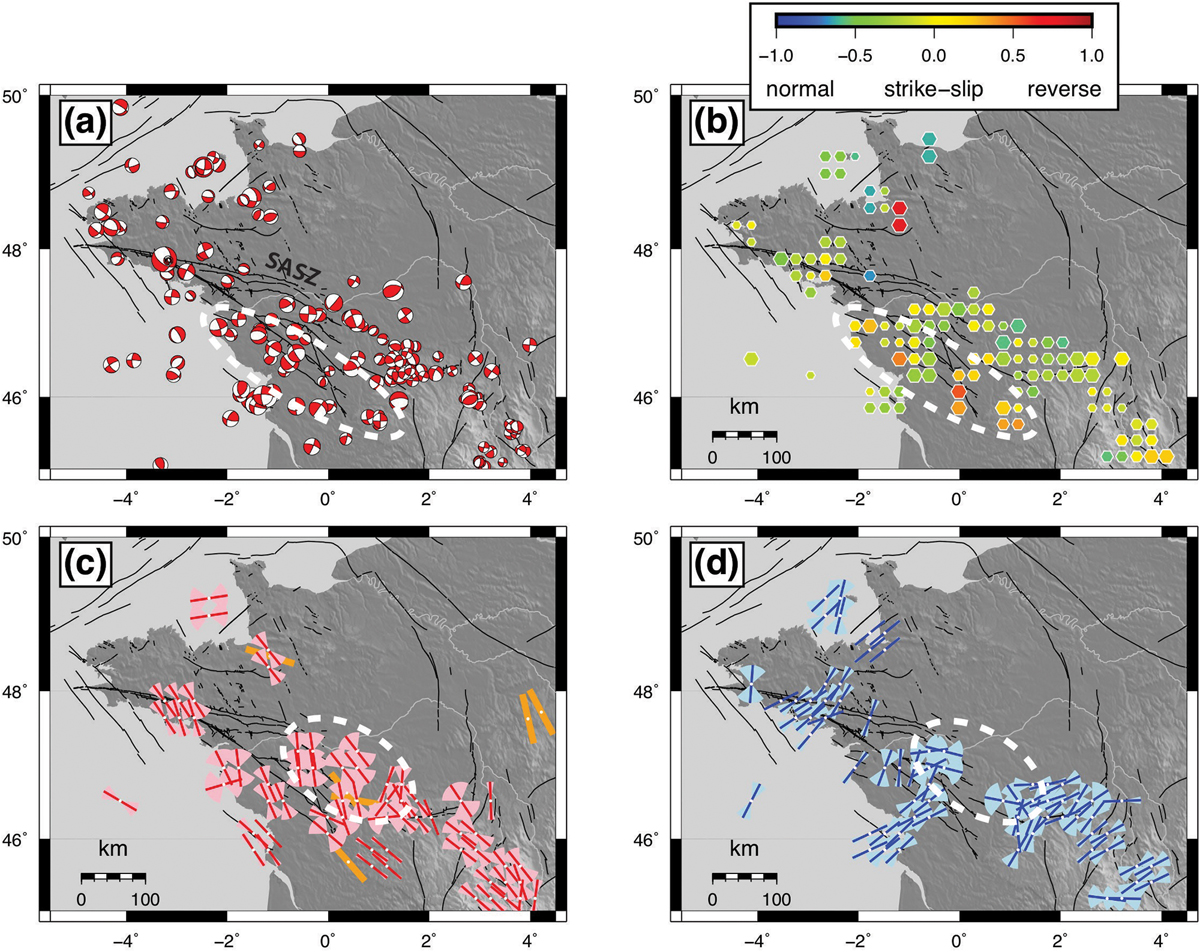
Fig. 6
Download original image
Focal mechanism maps for Western France. Symbols as in Figure 4. (a) Stereographic projections (lower hemisphere) of focal mechanisms. (b) Grid-average faulting style. (c) and (d) Grid-average orientations of near-horizontal P and T axes. Orange bars in (c) show in-situ maximum horizontal compressive stress orientations (Paquin et al., 1978). Thin black lines in (a)–(d) show geological and potentially active faults (Baize et al., 2013; Jomard et al., 2017). White dashed ellipses in (a)–(d) show areas of peculiar patterns discussed in the text. SASZ: South Armorican Shear Zone.
Current usage metrics show cumulative count of Article Views (full-text article views including HTML views, PDF and ePub downloads, according to the available data) and Abstracts Views on Vision4Press platform.
Data correspond to usage on the plateform after 2015. The current usage metrics is available 48-96 hours after online publication and is updated daily on week days.
Initial download of the metrics may take a while.