")
")
Fig. 12
Download original image
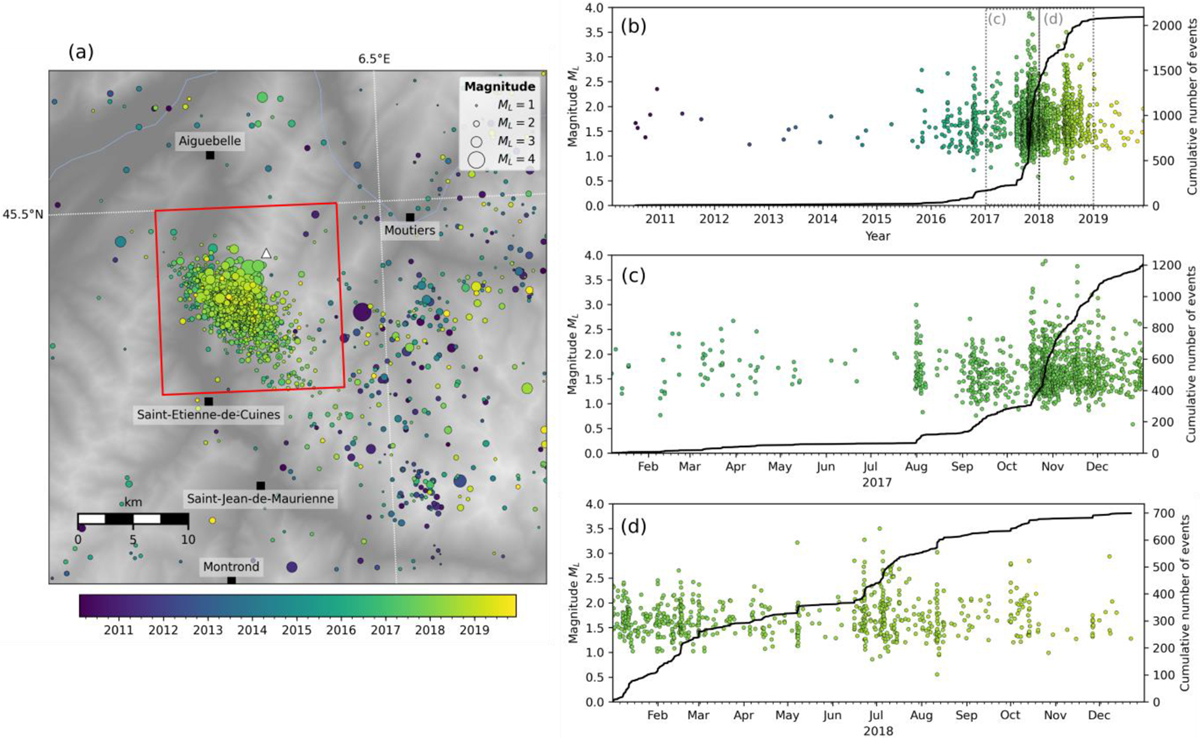
The Maurienne swarm. (a) Map of the seismicity from 2010 to 2019. The red frame highlights the location of Maurienne swarm and defines the selected earthquakes for the next subplots. The white triangle indicates the highest peak of the Lauzière Massif culminated at 2829 m. (b) Cumulative number of earthquakes from 2010 to 2019 and magnitude distribution in time. (c) Zoom on the cumulative number of earthquakes and magnitudes in 2017. (d) Zoom on the cumulative number of earthquakes and magnitudes in 2018.
Current usage metrics show cumulative count of Article Views (full-text article views including HTML views, PDF and ePub downloads, according to the available data) and Abstracts Views on Vision4Press platform.
Data correspond to usage on the plateform after 2015. The current usage metrics is available 48-96 hours after online publication and is updated daily on week days.
Initial download of the metrics may take a while.