")
")
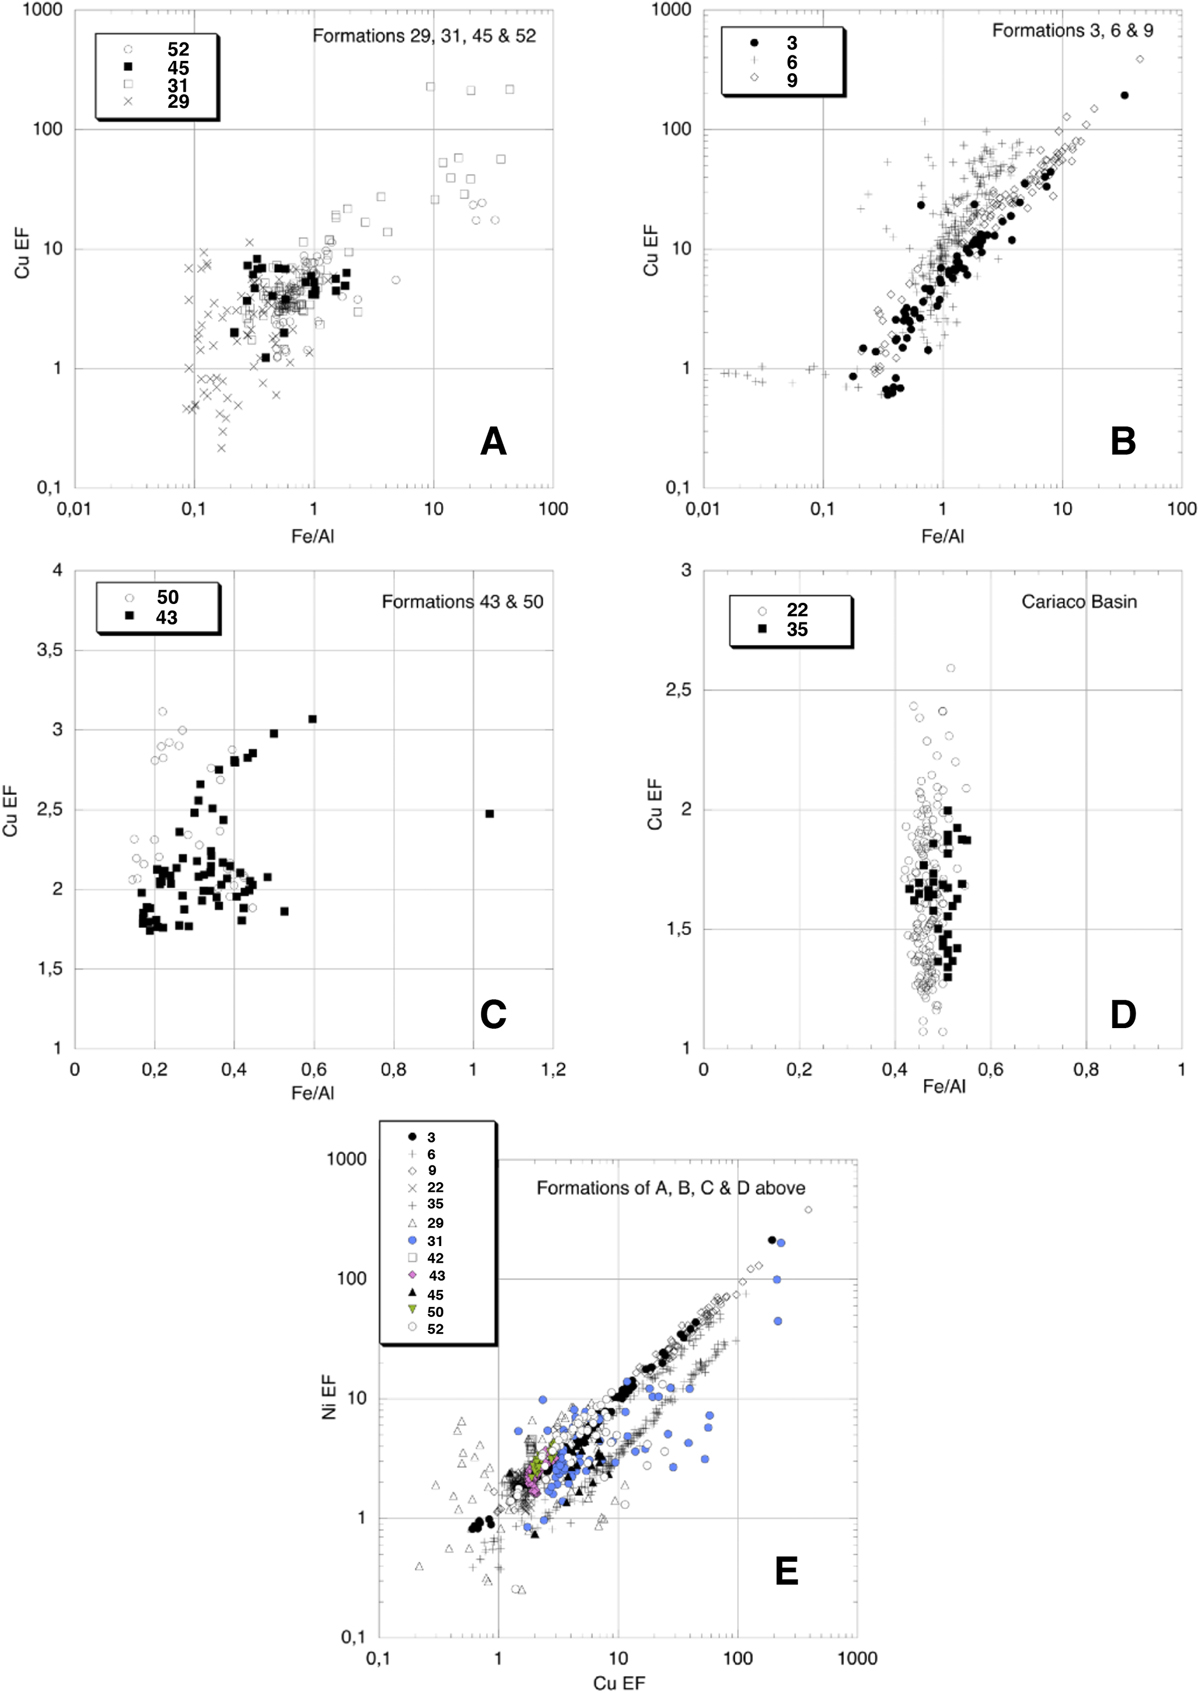
Fig. 2
Download original image
A to D: diagrams of the relations between the Fe:Al ratio and the enrichment factors in Cu (Cu-EF) for the formations illustrated on the right-hand side of Figure 1. Panel E shows the relations between the enrichment factors in Cu and Ni for all these formations mentioned in panels 2A to 2D. The formation names are listed in Table 1.
Current usage metrics show cumulative count of Article Views (full-text article views including HTML views, PDF and ePub downloads, according to the available data) and Abstracts Views on Vision4Press platform.
Data correspond to usage on the plateform after 2015. The current usage metrics is available 48-96 hours after online publication and is updated daily on week days.
Initial download of the metrics may take a while.