")
")
Open Access
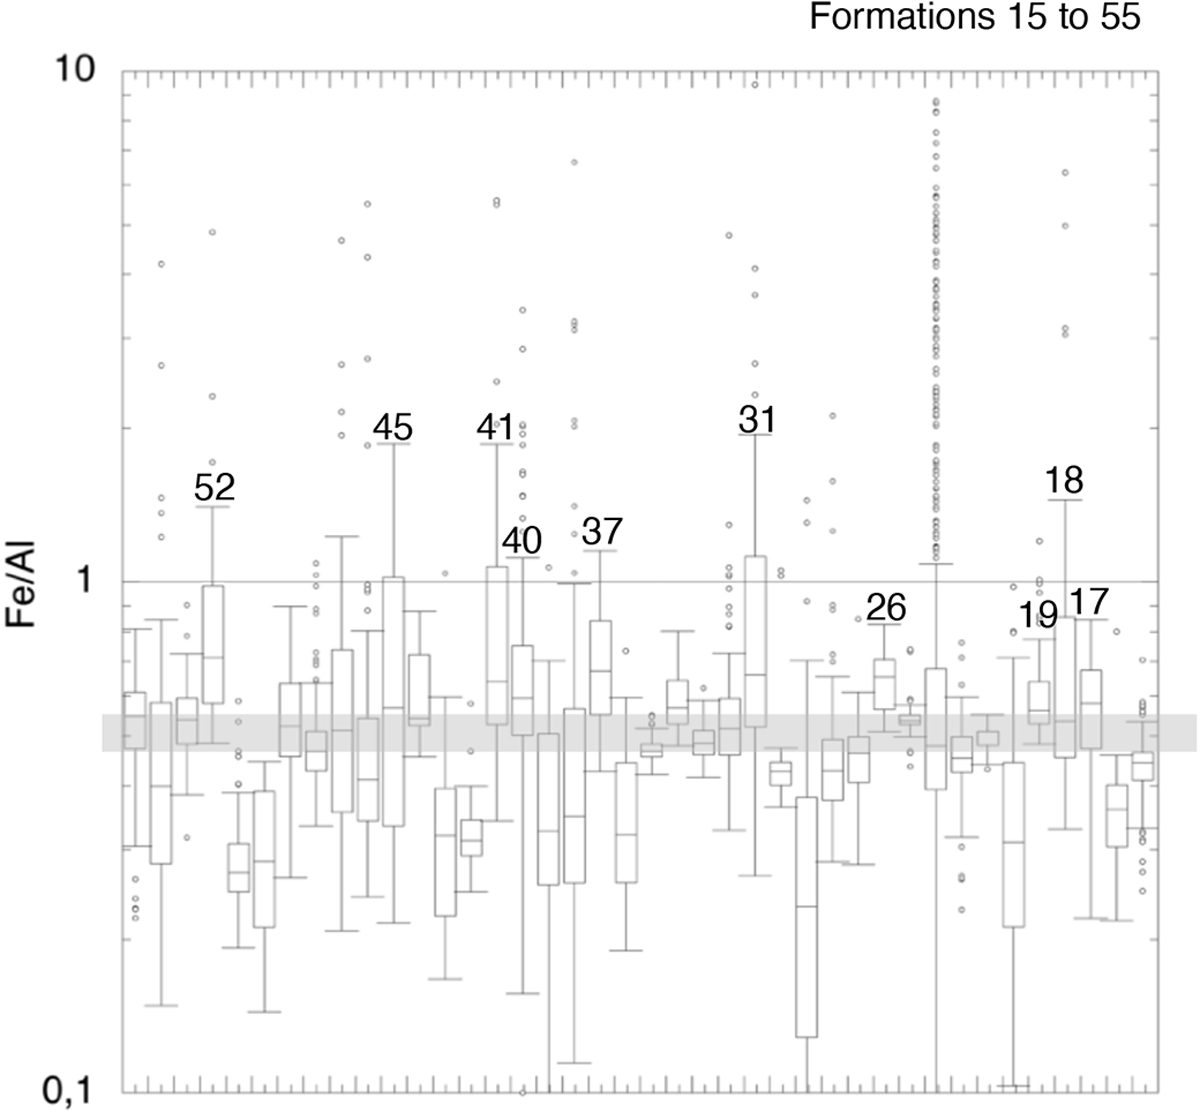
Fig. 3
Download original image
Box plot for all the formations with a significant TOC content (#15 to 55), illustrating the distribution of the Fe:Al ratio values. Shaded: average crustal value, close to 0.5. The formation names are listed in Table 1.
Current usage metrics show cumulative count of Article Views (full-text article views including HTML views, PDF and ePub downloads, according to the available data) and Abstracts Views on Vision4Press platform.
Data correspond to usage on the plateform after 2015. The current usage metrics is available 48-96 hours after online publication and is updated daily on week days.
Initial download of the metrics may take a while.