")
")
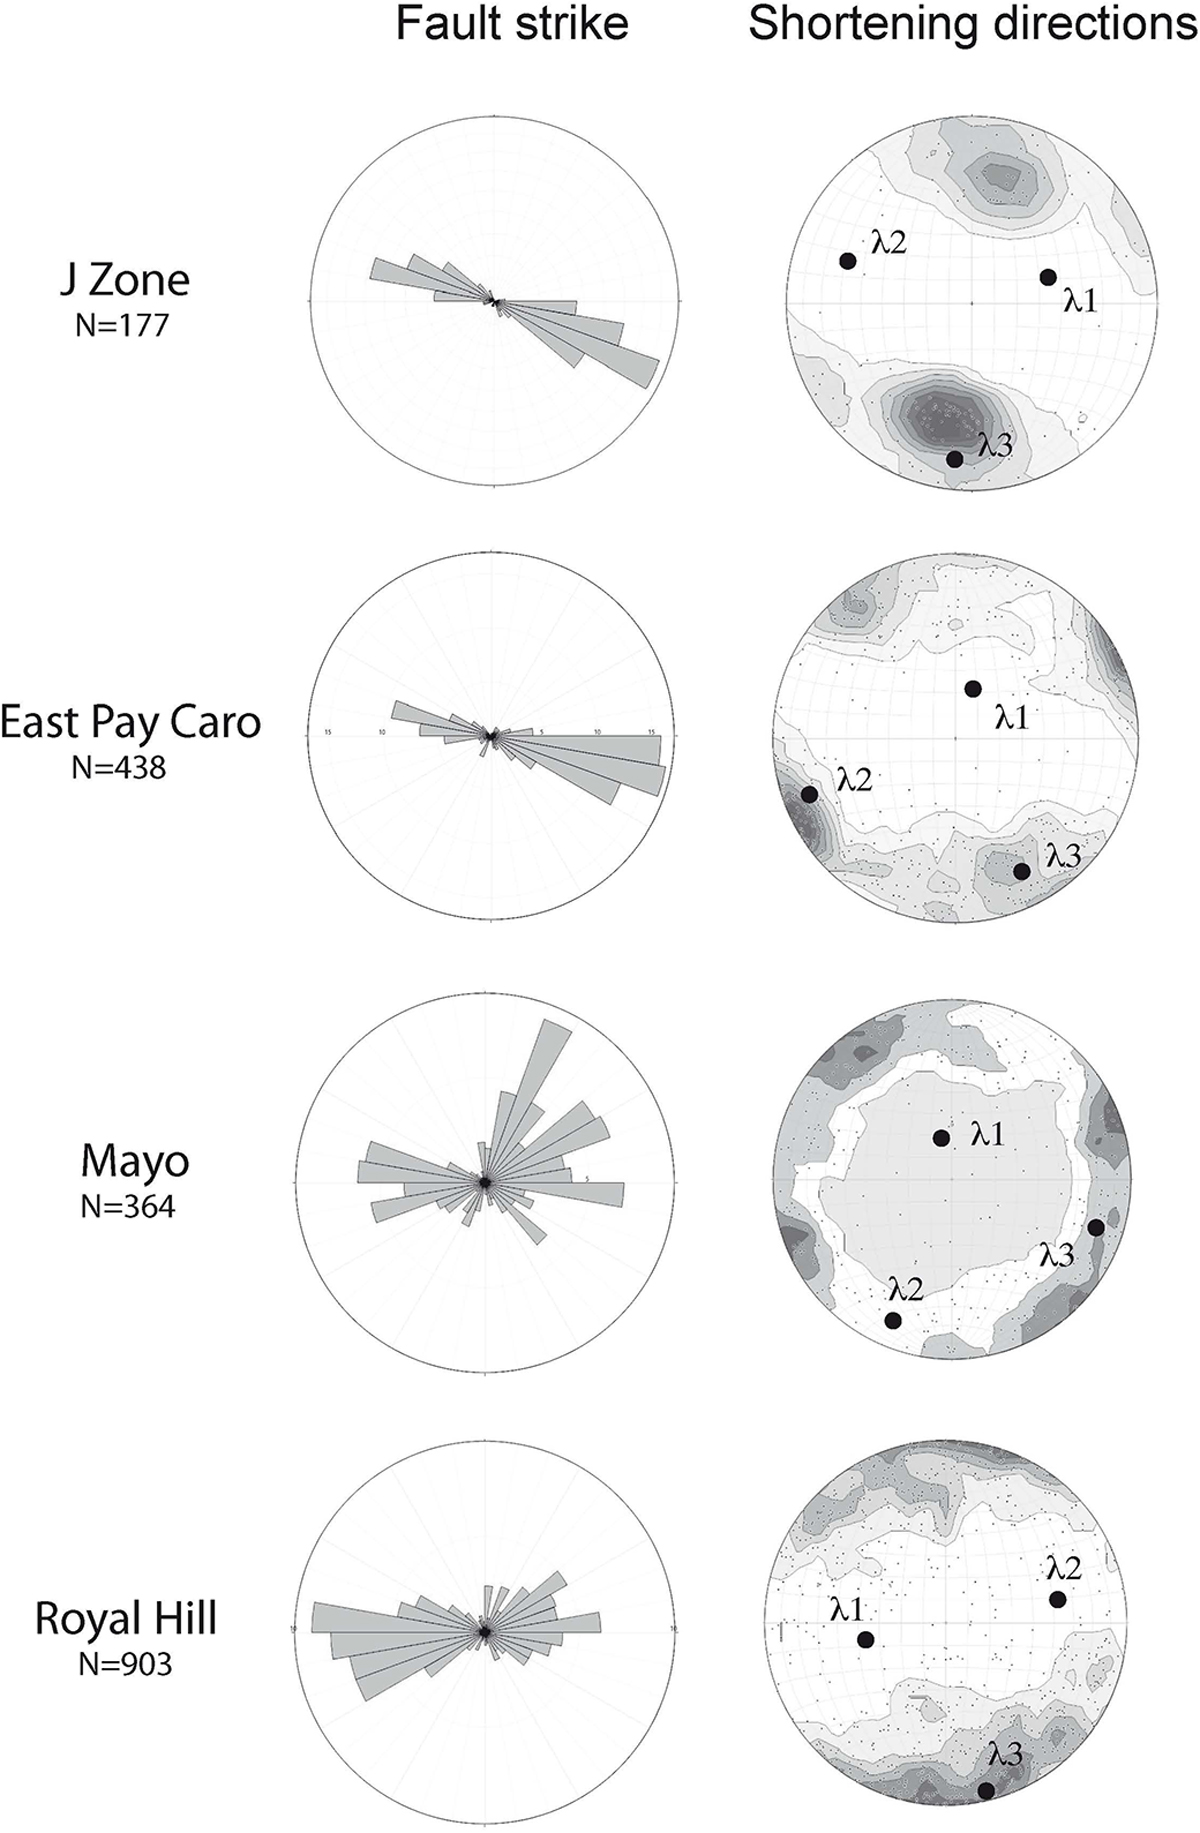
Fig. 13
Download original image
Fault patterns from four sites of the Rosebel district (“Faultkin” Allmendinger’s software (Marrett and Allmendinger, 1990; Allmendinger et al., 2011). Fault strike diagrams are direction rose diagrams. Stereograms for shortening directions show poles of faults, contours of associated principal shortening (equal area projection, lower hemisphere). λ1, λ2, λ3 refer to bulk principal stretch, intermediate, and shortening axes, respectively. N refers to the number of measured faults. See text for further comments.
Current usage metrics show cumulative count of Article Views (full-text article views including HTML views, PDF and ePub downloads, according to the available data) and Abstracts Views on Vision4Press platform.
Data correspond to usage on the plateform after 2015. The current usage metrics is available 48-96 hours after online publication and is updated daily on week days.
Initial download of the metrics may take a while.