")
")
Fig. 2
Download original image
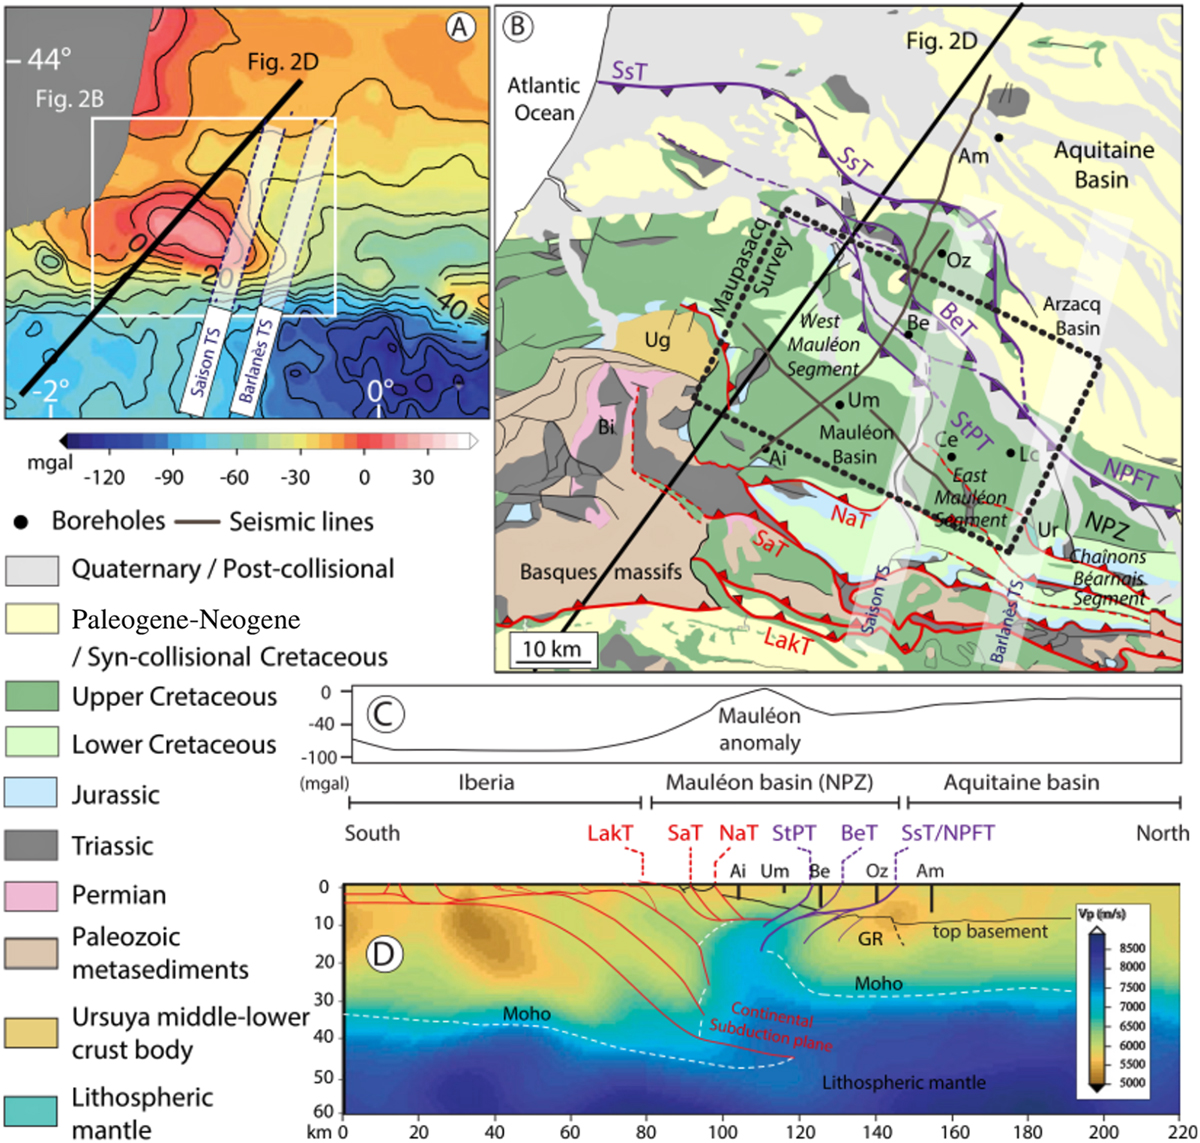
Geological setting. (A) Bouguer gravity map of the western part of the Pyrenean Belt (Casas et al., 1997), displaying a positive anomaly right upon the inverted hyperextended domain of the Mauléon Basin. Dark line: location of the Wang et al. (2016) VP model of subplot D. Contour intervals are 10 mgal. (B) Geological map illustrating the Mauléon Basin pop-up structure (Saspiturry, 2019, modified from). Main south-vergent thrust faults underlined in red, match from north to south with the North Arbailles Thrust (NaT), South Arbailles Thrust (SaT), and the Lakhoura Thrust (LakT). Main north-vergent thrust faults are represented in purple and correspond from south to north to the Saint-Palais Thrust (St-PT), Bellevue Thrust (BeT) and the Sainte-Suzanne Thrust (SsT) representing the western termination of the North Pyrenean Frontal Thrust (NPFT). The white shaded bands oriented N20° indicate the Saison and Barlanès transverse structures (TS) discussed in the text. Seismic reflection profiles in dark grey have been used to calibrate the uppermost and northern part of the Saspiturry et al. (2020b) Mauléon Basin section shown in subplot D. Ug: Ursuya granulites; Bi: Bidarray Permian Basin; Ur: Urdach mantle outcrop. Boreholes: Ai: Ainhice; Am: Amou; Be: Bellevue; Oz: Orthez; Um: Uhart-Mixe; Ce: Cheraute; Lc: Les Cassières; GR: Grand Rieu High. (C) Mauléon Basin Bouguer anomaly profile (Casas et al., 1997). (D) P-wave crustal model by Wang et al. (2016) with superimposed interpretation by Saspiturry et al. (2020b).
Current usage metrics show cumulative count of Article Views (full-text article views including HTML views, PDF and ePub downloads, according to the available data) and Abstracts Views on Vision4Press platform.
Data correspond to usage on the plateform after 2015. The current usage metrics is available 48-96 hours after online publication and is updated daily on week days.
Initial download of the metrics may take a while.