")
")
Fig. 2
Download original image
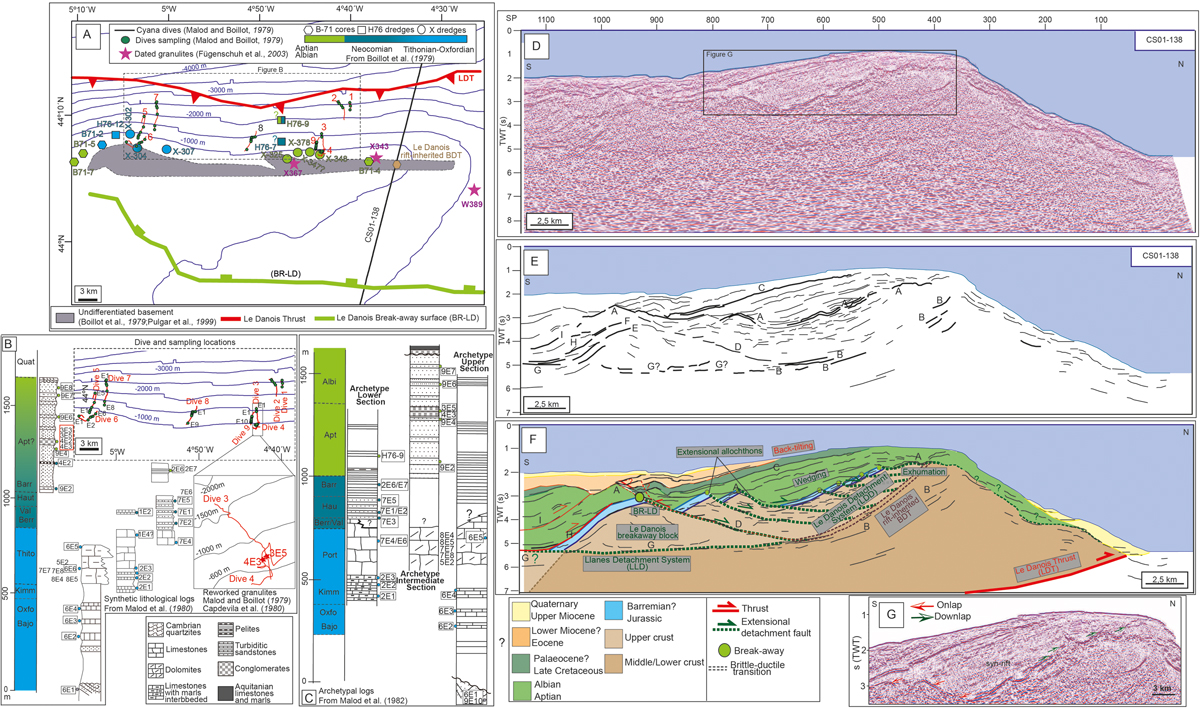
A. Map showing the trend of the dives and the location of samples, dredges and cores along the top and northern slope of the Le Danois High. The map also illustrates the location of the CS01-138 seismic profile, the granulite samples dated by Fügenschuh et al. (2003) and basement outcrops interpreted by Boillot et al. (1979) and Pulgar et al. (1999). Displayed is also the trend of the Le Danois breakaway surface (BR-LD) and the Le Danois Thrust (LDT), taken from Cadenas et al. (2020). B. Synthetic lithological logs constructed by Malod et al. (1980) based on the integration of samples from neighbouring dives. The map show the trend and location of the dives and the distribution of samples, which are also located along the logs. The small inset map shows the location of recovered samples including reworked clasts of granulites. C. Three archetype stratigraphic columns describing the stratigraphy of the sediment cover within the Le Danois High defined by Malod et al. (1982). D. CS01-138 time migrated seismic profile running from south to north across the Le Danois High. E. Ray tracing interpretation displaying the analysis of reflectivity patterns. F. Geological interpretation showing major structures and tectono-stratigraphic units within the Le Danois High and the geometry and associated basement features of the Le Danois Detachment System (LDD). BR-LD: Le Danois breakaway surface. Age constrains are from Cadenas et al. (2020). G. Segment of profile CS01-138 showing in detail the reflectivity patterns at the breakaway zone of the LDD.
Current usage metrics show cumulative count of Article Views (full-text article views including HTML views, PDF and ePub downloads, according to the available data) and Abstracts Views on Vision4Press platform.
Data correspond to usage on the plateform after 2015. The current usage metrics is available 48-96 hours after online publication and is updated daily on week days.
Initial download of the metrics may take a while.