")
")
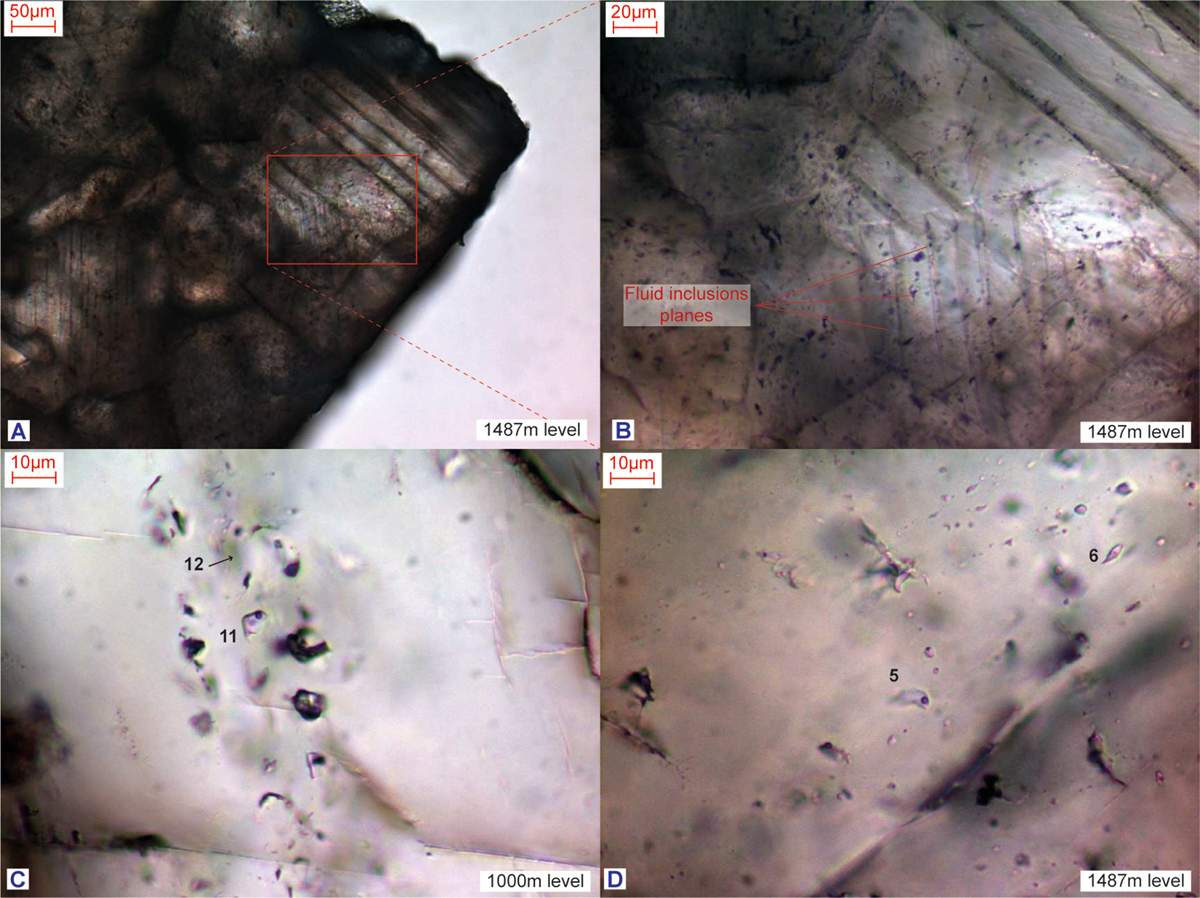
Fig. 6
Download original image
(A and B) Microphotographs of typical fluid inclusions planes observed in the calcite cleavage. (C and D) Microphotographs of typical fluid inclusions observed in the two levels (1000 m and 1487 m) of the Clarens-1 well.
Current usage metrics show cumulative count of Article Views (full-text article views including HTML views, PDF and ePub downloads, according to the available data) and Abstracts Views on Vision4Press platform.
Data correspond to usage on the plateform after 2015. The current usage metrics is available 48-96 hours after online publication and is updated daily on week days.
Initial download of the metrics may take a while.