")
")
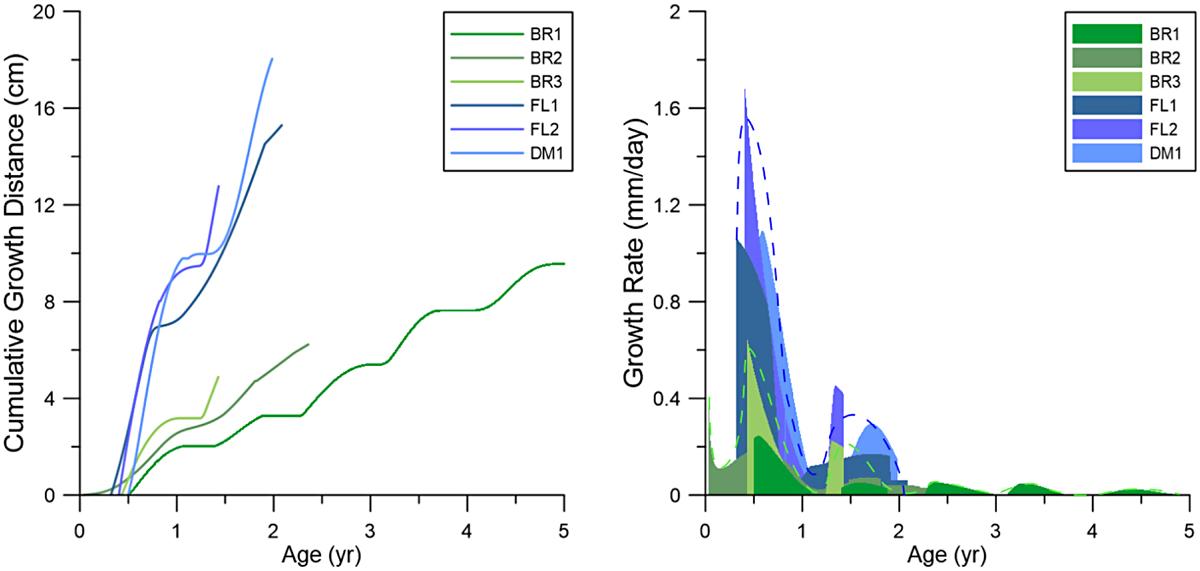
Fig. 7
Download original image
(A) Cumulative growth distances in cm for each specimen against time, showing the difference between the Paris and Hampshire Basins. (B) Growth Rate in mm per day for each specimen against time, showing the similarity in timing of growth cessations and difference in maximum growth rate between the Paris and Hampshire Basins. Idealized growth rates, estimating the average growth rate per species, per basin shown as a colored (blue and green for the Paris and Hampshire Basins, respectively) dotted line.
Current usage metrics show cumulative count of Article Views (full-text article views including HTML views, PDF and ePub downloads, according to the available data) and Abstracts Views on Vision4Press platform.
Data correspond to usage on the plateform after 2015. The current usage metrics is available 48-96 hours after online publication and is updated daily on week days.
Initial download of the metrics may take a while.