")
")
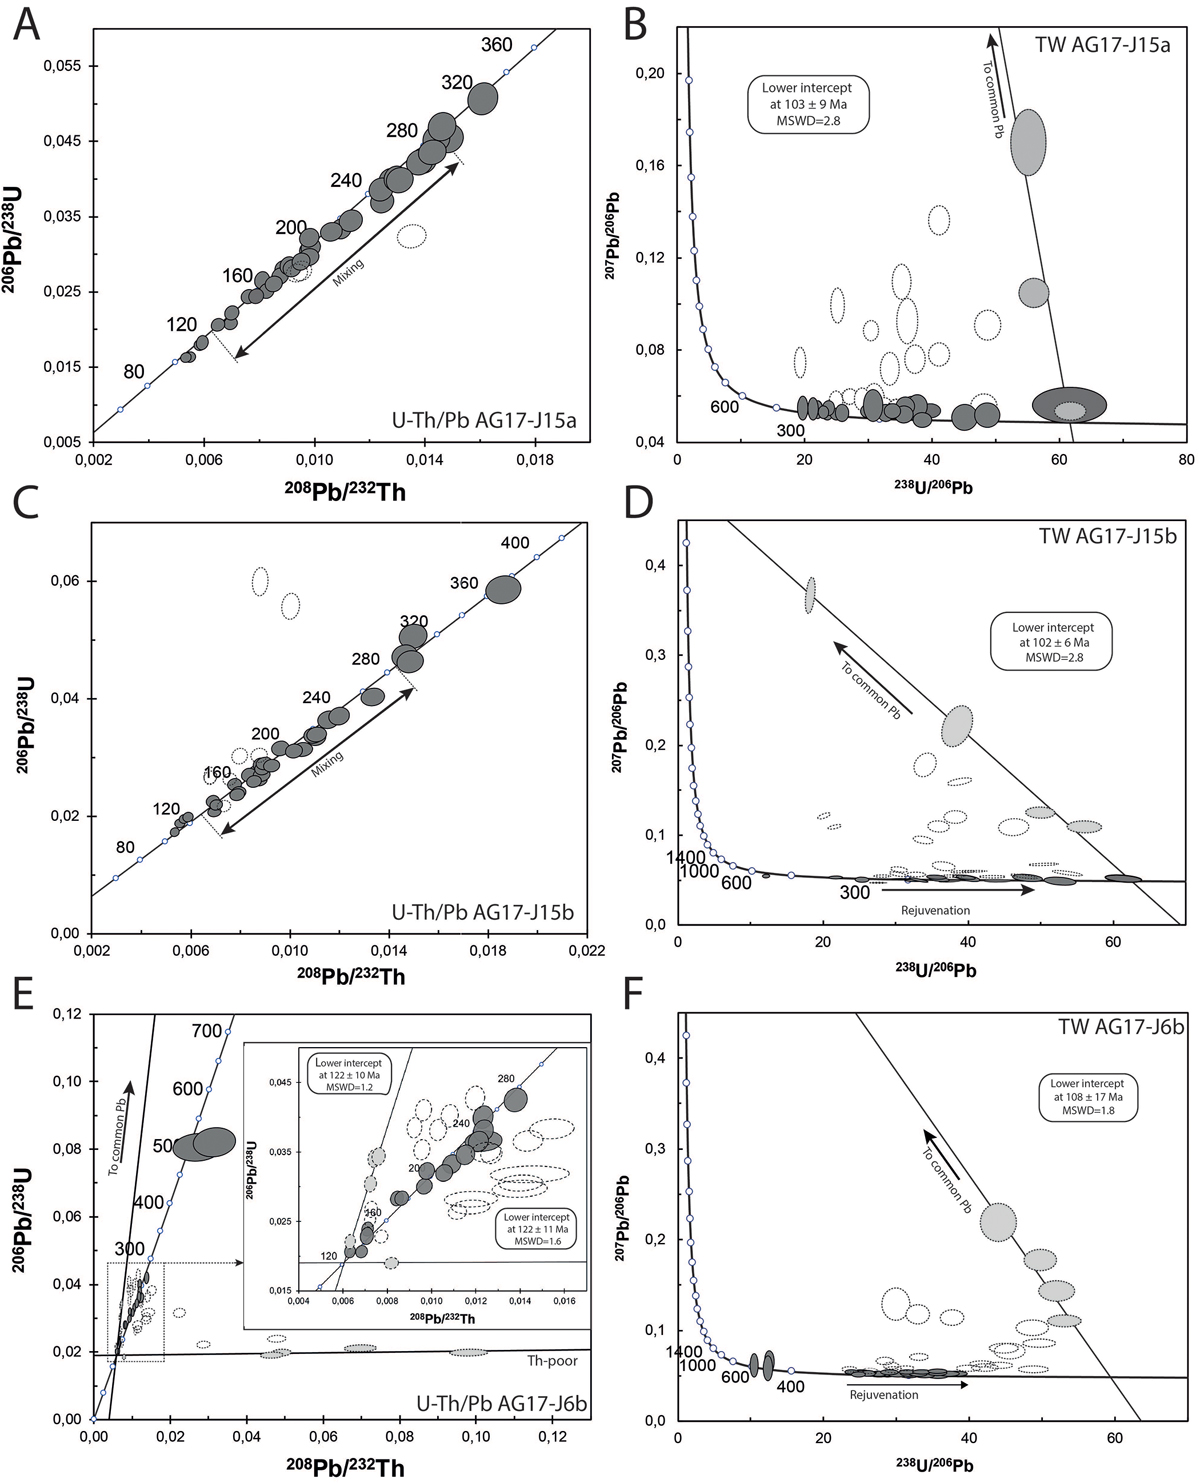
Fig. 7
Download original image
(A) 208Pb/232Th vs. 206Pb/238U diagram for monazites in sample AG17-J15a. Dashed ellipses correspond to discordant data. Dark ellipses correspond to concordant ages affected (or not) by mixing between M1 and M2 monazite domains. White ellipses correspond to M2 analyses affected by common Pb contamination and mixing with the M1 domain. Grey ellipses correspond to analyses used for the Discordia calculation. (B) Tera–Wasserburg diagram for the same sample. (C) 208Pb/232Th vs. 206Pb/238U diagram for monazites (sample AG17-J15b) and (D) associated Tera–Wasserburg diagram. (E) 208Pb/232Th versus 206Pb/238U diagram for monazites in sample AG17-J6b. Dashed ellipses correspond to discordant data. Grey ellipses correspond to analyses used for the Discordia calculation. This sample is characterized by two populations of chemically distinct monazites, which allow two Discordia lines to be drawn. See the text for detailed explanations. (F) Tera–Wasserburg diagram for the same sample.
Current usage metrics show cumulative count of Article Views (full-text article views including HTML views, PDF and ePub downloads, according to the available data) and Abstracts Views on Vision4Press platform.
Data correspond to usage on the plateform after 2015. The current usage metrics is available 48-96 hours after online publication and is updated daily on week days.
Initial download of the metrics may take a while.