")
")
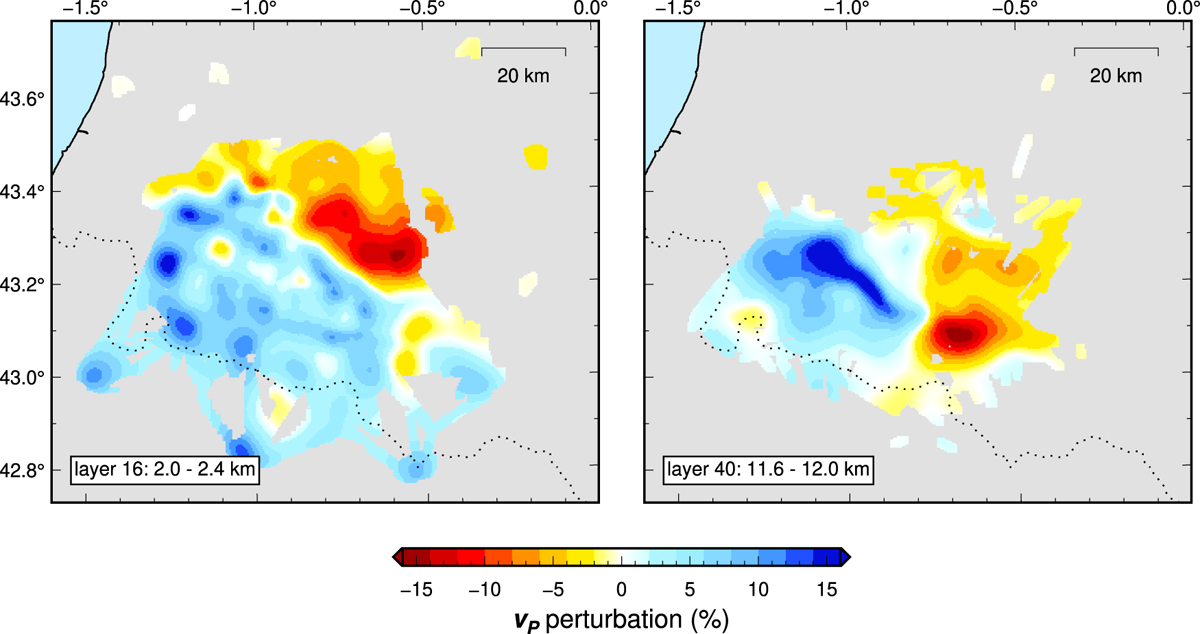
Fig. 15
Download original image
Horizontal slices through the P-wave velocity model of the Mauléon region (Villaseñor et al., 2019): (a) layer between 2 and 2.4 km depth, and (b) layer between 11.6 and 12 km depth. Open blue triangles are stations used in the tomography. Small circles are earthquakes with focal depth inside the layer. Velocities are shown as perturbation in percentage with respect to P-wave velocity in the initial model.
Current usage metrics show cumulative count of Article Views (full-text article views including HTML views, PDF and ePub downloads, according to the available data) and Abstracts Views on Vision4Press platform.
Data correspond to usage on the plateform after 2015. The current usage metrics is available 48-96 hours after online publication and is updated daily on week days.
Initial download of the metrics may take a while.