")
")
Fig. 12
Download original image
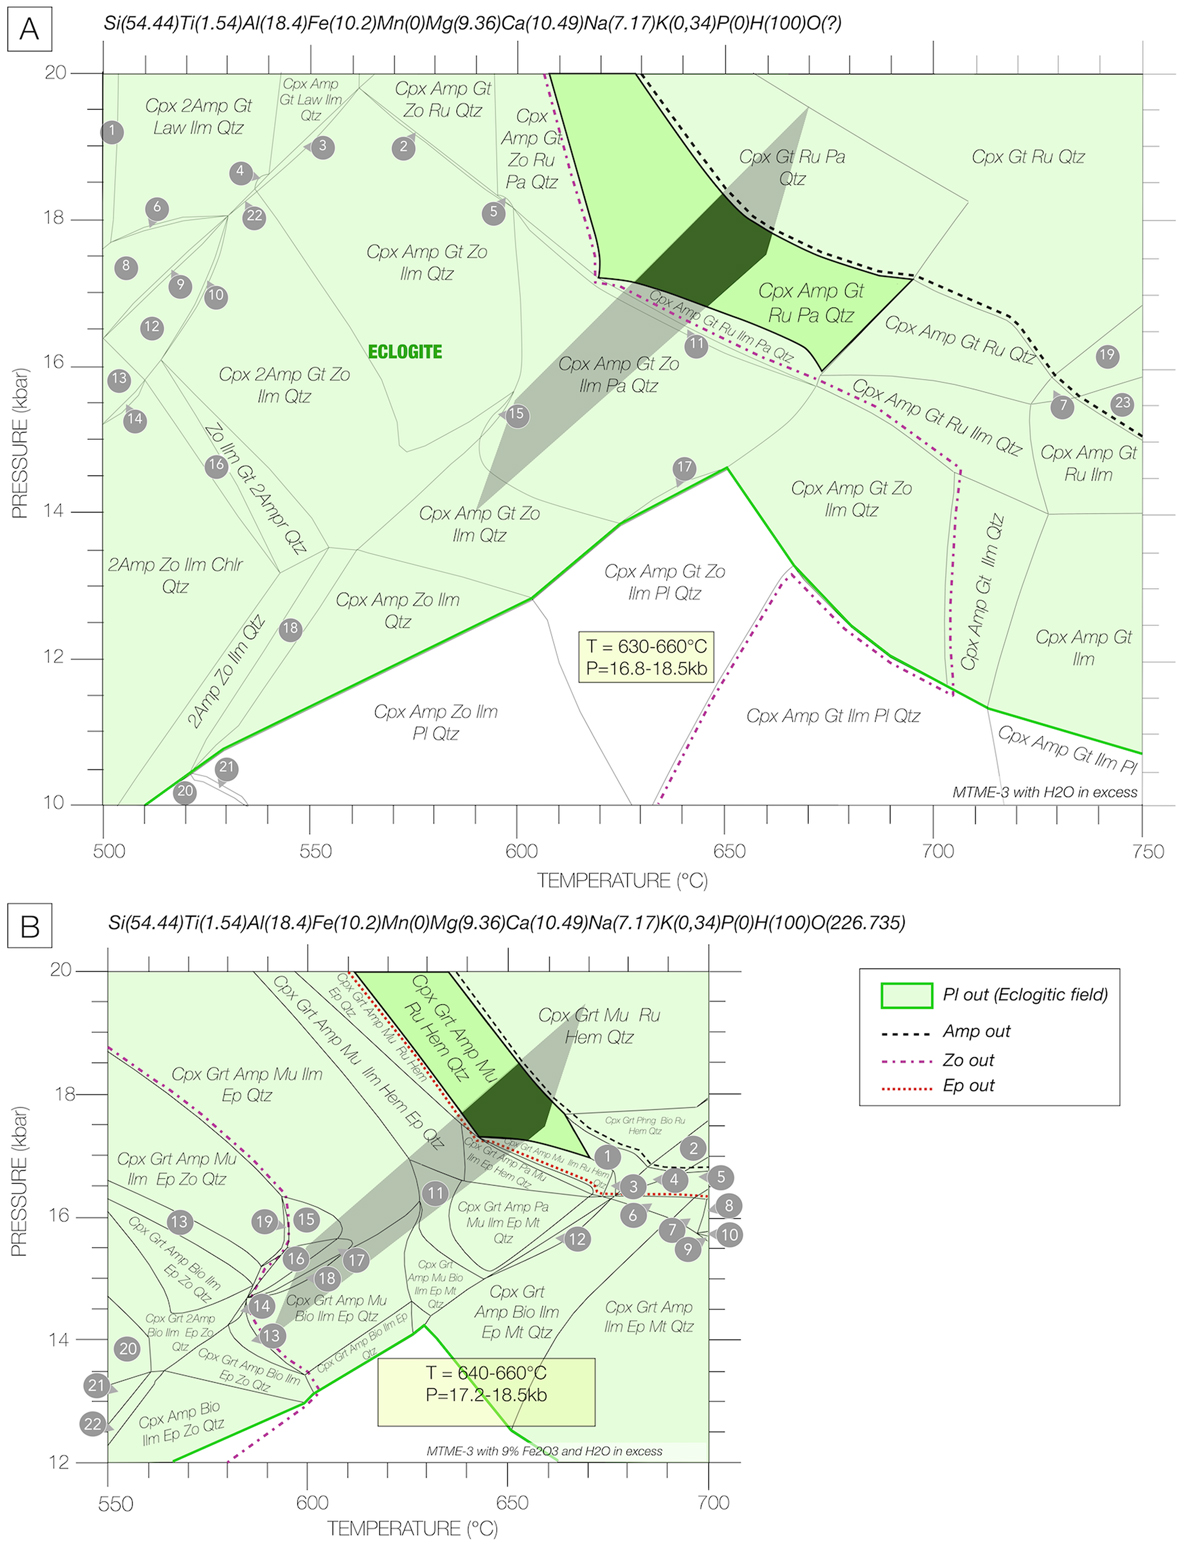
(A) P−T pseudosection calculated for the sample MTME3 modeled composition in H2O saturated conditions. The shaded field corresponds to the results of Figure 11. Numbered fields represent the following assemblages: 1: Cpx Amp Ilm Law Chlr Qtz. 2: Cpx Gt Amp Ilm Ru Zo Qtz. 3: Cpx Gt Amp Ilm Qtz. 4: Cpx Gt 2Amp Ilm Qtz. 5: Cpx Gt Amp Ru Zo Qtz. 6: Cpx Gt Amp Ilm Law Qtz. 7: Cpx Gt Amp Ru. 8: Cpx Gt Amp Ilm Law Chlr Qtz. 9: Cpx Gt Amp Ilm Zo Law Chlr Qtz. 10: Cpx Gt Amp Ilm Zo Qtz. 11: Cpx Gt Amp Ru Ilm Zo Pa Qtz. 12: Cpx Gt Amp Ilm Zo Chlr Qtz. 13: Cpx Amp Ilm Zo Chlr Qtz. 14: Amp Ilm Zo Chlr Qtz. 15: Cpx Gt Amp Ilm Zo Qtz. 16: 2Amp Ilm Zo Qtz. 17: Cpx Gt Amp Ilm Zo Qtz. 18: Cpx 2Amp Ilm Zo Qtz. 19: Cpx Gt Ru. 20: 2Amp Ilm Zo Pl Qtz. 21: 2Amp Cpx Ilm Zo Pl Qtz. 22: Cpx 2Amp Gt Ilm Qtz. 23: Ilm Cpx Gt Ru. (B) P−T pseudosection calculated for the same sample for modeled composition in H2O saturated conditions with a value at 9% Fe2O3 of total FeO. Numbered fields match with the following assemblages: 1: Cpx Grt Amp Phng Bio Ru Hem Qtz. 2: Cpx Grt Bio Ru Hem Qtz. 3: Cpx Grt Amp Phng Ru Hem Qtz. 4: Cpx Grt Amp Bio Ru Hem Qtz. 5: Cpx Grt Amp Bio Ru Hem Mt Qtz. 6: Cpx Grt Amp Bio Ru Ep Mt Qtz. 7: Cpx Grt Amp Ru Ep Mt Qtz. 8: Cpx Grt Amp Ru Mt Qtz. 9: Cpx Grt Amp Ilm Ru Mt Ep Qtz. 10: Cpx Grt Amp Ilm Ru Mt Qtz. 11: Cpx Grt Amp Mu Ilm Ep Mt Qtz. 12: Cpx Grt Amp Mu Bio Ilm Ep Mt Qtz. 13: Cpx Grt Amp Mu Bio Ilm Ep Zo Qtz. 14: Cpx Grt Amp Bio Ilm Ep Zo Qtz. 15: Cpx Grt Amp Mu Pa Ilm Ep Qtz. 16: Cpx Grt 2Amp Mu Pa Ilm Ep Qtz. 17: Cpx Grt 2Amp Mu Ilm Ep Qtz. 18: Cpx Grt Amp Mu Ilm Ep Qtz. 19: Cpx Grt Amp Mu Ilm Ep Qtz. 20: Grt 2Amp Bio Ilm Ep Zo Qtz. 21: Grt Amp Bio Ilm Ep Zo Qtz. 22: Cpx Grt Amp Bio Ilm Ep Zo Qtz. In pseudosections, the main field of interest is highlighted in green, corresponding to the observed mineral assemblage. The dark grey field represents the intersection between the two calculation methods and thus the most probable peak P−T conditions.
(A) Pseudosection P−T calculée à partir d’une composition modélisée de l’échantillon MTME3 en condition saturée en H2O. Le champ obscurci représente le champ P−T de la figure 11. Les champs numérotés correspondent aux assemblages suivants : 1 : Cpx Amp Ilm Law Chlr Qtz. 2 : Cpx Gt Amp Ilm Ru Zo Qtz. 3 : Cpx Gt Amp Ilm Qtz. 4 : Cpx Gt 2Amp Ilm Qtz. 5 : Cpx Gt Amp Ru Zo Qtz. 6 : Cpx Gt Amp Ilm Law Qtz. 7 : Cpx Gt Amp Ru. 8 : Cpx Gt Amp Ilm Law Chlr Qtz. 9 : Cpx Gt Amp Ilm Zo Law Chlr Qtz. 10 : Cpx Gt Amp Ilm Zo Qtz. 11 : Cpx Gt Amp Ru Ilm Zo Pa Qtz. 12 : Cpx Gt Amp Ilm Zo Chlr Qtz. 13 : Cpx Amp Ilm Zo Chlr Qtz. 14 : Amp Ilm Zo Chlr Qtz. 15 : Cpx Gt Amp Ilm Zo Qtz. 16 : 2Amp Ilm Zo Qtz. 17 : Cpx Gt Amp Ilm Zo Qtz. 18 : Cpx 2Amp Ilm Zo Qtz. 19 : Cpx Gt Ru. 20 : 2Amp Ilm Zo Pl Qtz. 21 : 2Amp Cpx Ilm Zo Pl Qtz. 22 : Cpx 2Amp Gt Ilm Qtz. 23 : Ilm Cpx Gt Ru. (B) Pseudosection P−T calculée à partir d’une composition modélisée du même échantillon en présence de 9 % de Fe2O3 calculé sur la teneur totale en FeO. Les champs numérotés correspondent aux assemblages suivants : 1 : Cpx Grt Amp Phng Bio Ru Hem Qtz. 2 : Cpx Grt Bio Ru Hem Qtz. 3 : Cpx Grt Amp Phng Ru Hem Qtz. 4 : Cpx Grt Amp Bio Ru Hem Qtz. 5 : Cpx Grt Amp Bio Ru Hem Mt Qtz. 6 : Cpx Grt Amp Bio Ru Ep Mt Qtz. 7 : Cpx Grt Amp Ru Ep Mt Qtz. 8 : Cpx Grt Amp Ru Mt Qtz. 9 : Cpx Grt Amp Ilm Ru Mt Ep Qtz. 10 : Cpx Grt Amp Ilm Ru Mt Qtz. 11 : Cpx Grt Amp Mu Ilm Ep Mt Qtz. 12 : Cpx Grt Amp Mu Bio Ilm Ep Mt Qtz. 13 : Cpx Grt Amp Mu Bio Ilm Ep Zo Qtz. 14 : Cpx Grt Amp Bio Ilm Ep Zo Qtz. 15 : Cpx Grt Amp Mu Pa Ilm Ep Qtz. 16 : Cpx Grt 2Amp Mu Pa Ilm Ep Qtz. 17 : Cpx Grt 2Amp Mu Ilm Ep Qtz. 18 : Cpx Grt Amp Mu Ilm Ep Qtz. 19 : Cpx Grt Amp Mu Ilm Ep Qtz. 20 : Grt 2Amp Bio Ilm Ep Zo Qtz. 21 : Grt Amp Bio Ilm Ep Zo Qtz. 22 : Cpx Grt Amp Bio Ilm Ep Zo Qtz. Le champ d’intérêt dont l’assemblage minéralogique est le plus proche de la paragénèse de haute pression observée apparaît en teinte verte vive sur les deux modèles. La zone noircie correpond à l’intersection entre les deux champs obtenus.
Current usage metrics show cumulative count of Article Views (full-text article views including HTML views, PDF and ePub downloads, according to the available data) and Abstracts Views on Vision4Press platform.
Data correspond to usage on the plateform after 2015. The current usage metrics is available 48-96 hours after online publication and is updated daily on week days.
Initial download of the metrics may take a while.