")
")
Fig. 6
Download original image
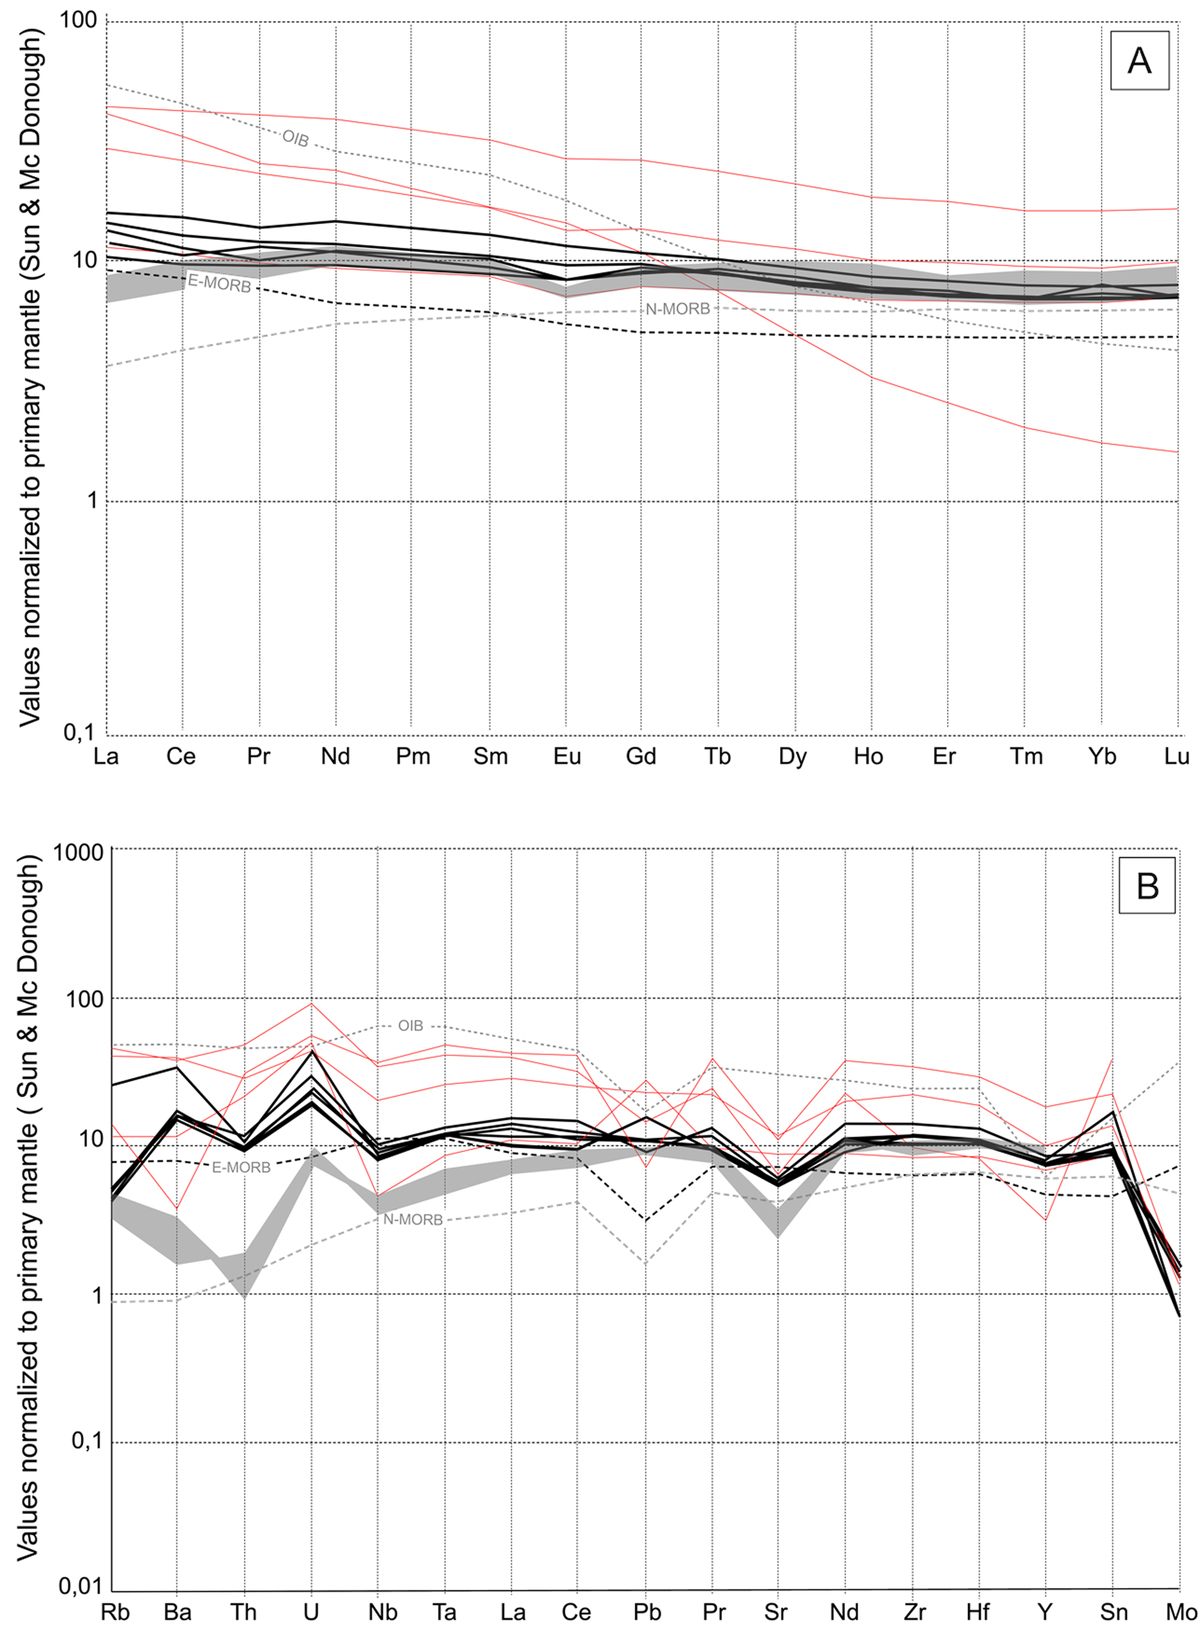
(A) Primitive mantle-normalized Rare Earth Elements pattern. (B) Primitive mantle-normalized High Field Strength Elements Patterns. OIB, E-MORB and N-MORB compositions (after Sun and McDonough, 1989) are plotted as dotted lines for comparison. Black lines correspond to the best preserved eclogites, while red lines correspond to severely retrogressed samples. Grey areas represent the compositional range to the best-preserved Sardinian eclogites (after Cruciani et al., 2015).
(A) Spectres en terres rares normalisées à la composition du manteau primitif. (B) Spectres en éléments à fort effet de champ (faibles rayons ioniques et fortes charges, HFSE) normalisés à la composition du manteau primitif. Les spectres en OIB, N-MORB et E-MORB sont présentés à titre de référence (d’après Sun et McDonough, 1989). La zone grisée représente la gamme des spectres obtenus à partir des échantillons des éclogites sardes les mieux préservées (d’après Cruciani et al., 2015).
Current usage metrics show cumulative count of Article Views (full-text article views including HTML views, PDF and ePub downloads, according to the available data) and Abstracts Views on Vision4Press platform.
Data correspond to usage on the plateform after 2015. The current usage metrics is available 48-96 hours after online publication and is updated daily on week days.
Initial download of the metrics may take a while.