")
")
Open Access
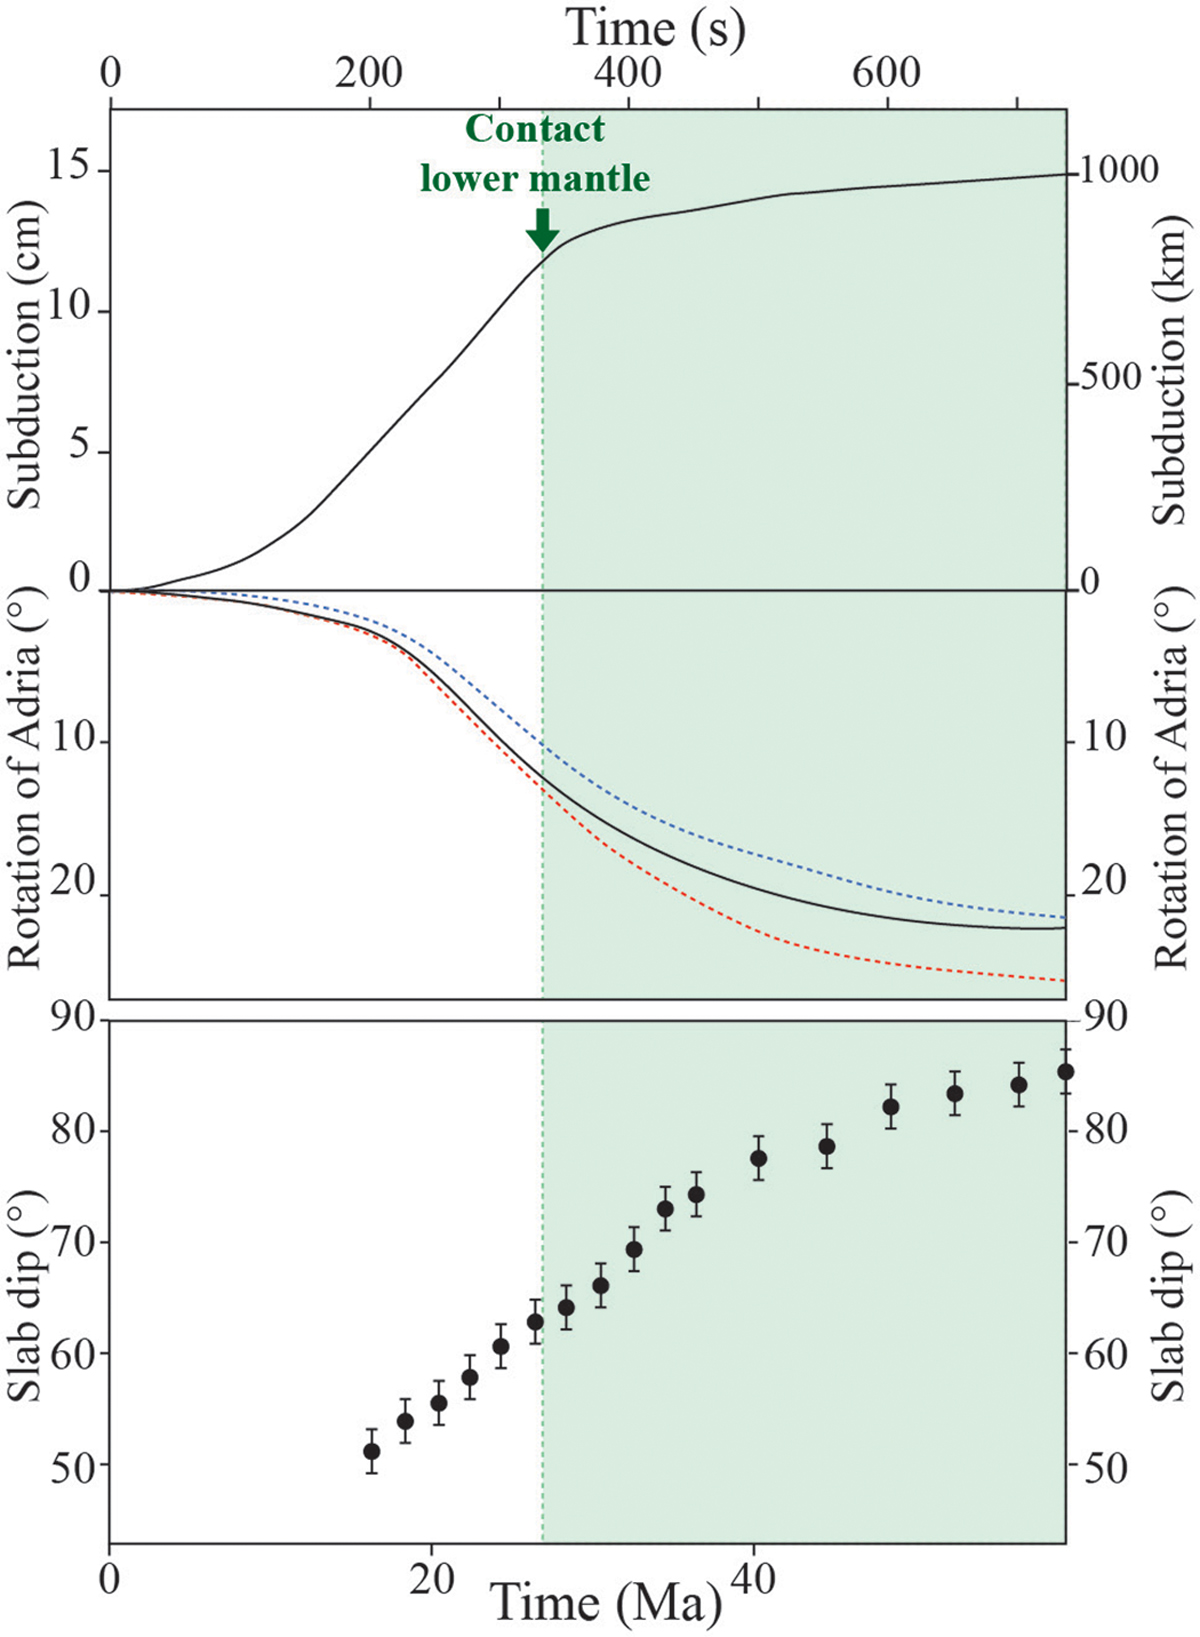
Fig. 3
Download original image
Amount of subduction, counterclockwise rotation of Adria and dip of the slab, vs. time, in Model 1. Blue and red dotted curves indicate rotations of northern and southern Adria, respectively, and the black curve the average rotation of the plate. Slab dip is measured beneath the African margin.
Current usage metrics show cumulative count of Article Views (full-text article views including HTML views, PDF and ePub downloads, according to the available data) and Abstracts Views on Vision4Press platform.
Data correspond to usage on the plateform after 2015. The current usage metrics is available 48-96 hours after online publication and is updated daily on week days.
Initial download of the metrics may take a while.