")
")
Fig. 11
Download original image
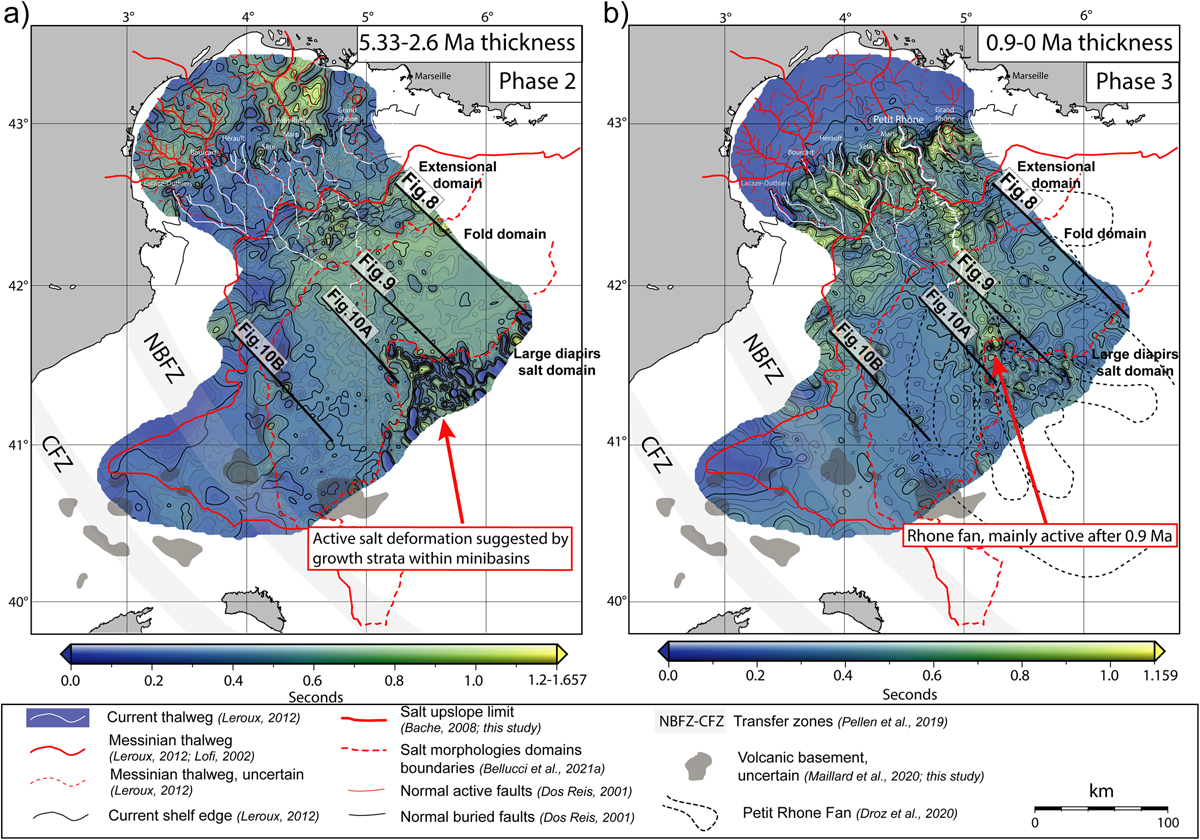
Isochrone maps (in TWTT seconds) of the main Pliocene-Pleistocene units in the Provençal Basin. (a) The MSC-P11 TWTT-thickness (5.33-2.6 Ma) map corresponds to the salt tectonics phase 2, characterized by the formation of the listric faults in the extensional domain. (b) Q10-SB (0.9-0 Ma) TWTT-thickness map corresponds to the youngest part of the salt tectonics phase 3 described in this work, characterized by an intense deformation and orientation of the salt structures in the present-day Rhône thalweg direction. The profiles are shown in Figures 8, 9 and 10.
Cartes isochrones (en secondes TWTT) des principales unités pliocènes-pléistocènes dans le Bassin Provençal. a) La carte d’épaisseur TWTT du MSC-P11 (5,33-2,6 Ma) correspond à la phase 2 de la tectonique salifère. b) La carte d’épaisseur TWTT du Q10-SB (0,9-0 Ma) correspond à la partie la plus récente de la phase 3 de la tectonique salifère décrite dans ce travail.
Current usage metrics show cumulative count of Article Views (full-text article views including HTML views, PDF and ePub downloads, according to the available data) and Abstracts Views on Vision4Press platform.
Data correspond to usage on the plateform after 2015. The current usage metrics is available 48-96 hours after online publication and is updated daily on week days.
Initial download of the metrics may take a while.