")
")
Fig. 2
Download original image
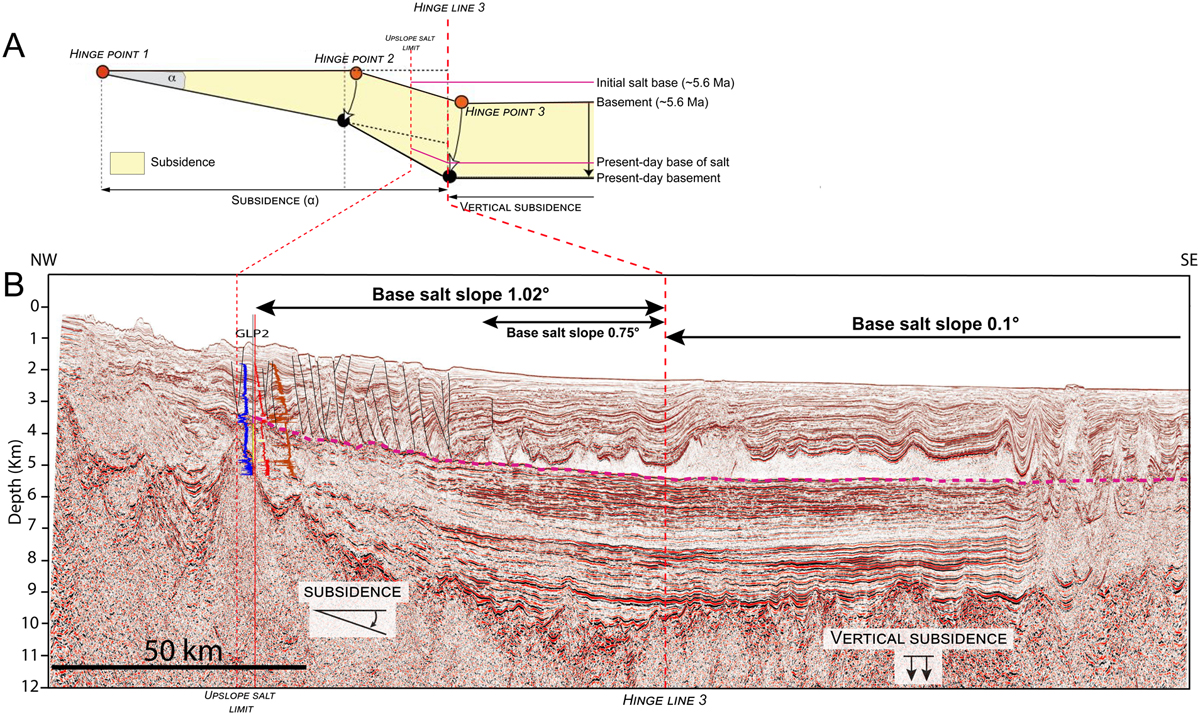
(A) Sketch illustrating how has been analysed the subsidence pattern of the Provencal Basin (modified after Rabineau, 2001 and Leroux, 2012). Hinge line 3 marks the boundary between a tilting and purely vertical subsidence. Dotted black lines highlight the slope changing basinward the hinge points. Note the increasing slope history on the margin given by subsidence while the deep basin subsides purely vertically. B) Seismic profile (in depth, km) (TGS-Nopec) crossing perpendicularly the Provençal Basin (location in Fig. 1) showing the base of salt slope values (dashed purple line) in the lower slope and deep basin. The profile is modified from Bache et al., 2015. Vertical exaggeration ×6.
(A) Croquis illustrant l’analyse de la subsidence du Bassin Provençal (modifié d’après Rabineau, 2001 and Leroux, 2012). (B) Profil sismique (en profondeur, km) (TGS-Nopec) traversant perpendiculairement le Bassin Provençal (localisation dans la Fig. 1) montrant les valeurs de la pente de la base du sel (en pointillés violets) sur la pente inférieure et dans le bassin profond.
Current usage metrics show cumulative count of Article Views (full-text article views including HTML views, PDF and ePub downloads, according to the available data) and Abstracts Views on Vision4Press platform.
Data correspond to usage on the plateform after 2015. The current usage metrics is available 48-96 hours after online publication and is updated daily on week days.
Initial download of the metrics may take a while.