")
")
Fig. 9
Download original image
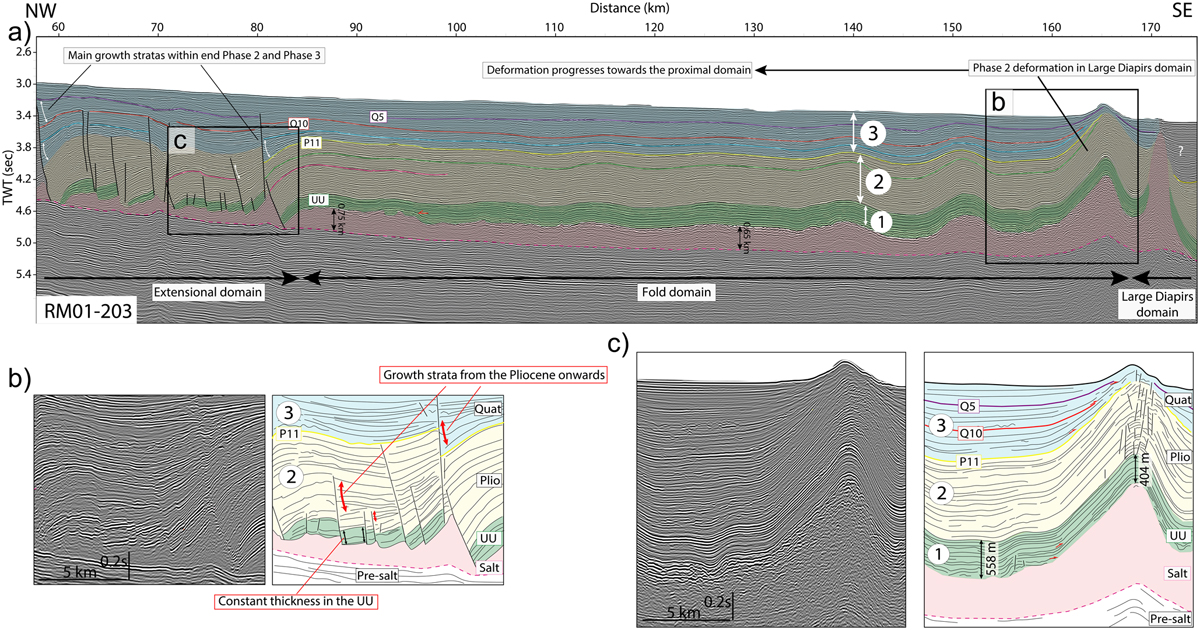
(a) Seismic profile crossing the N-E sector of the Provençal Basin. The three stratigraphic intervals depicted in this work are shown. (b) Zoom showing the active growth strata starting from the Lower Pliocene onwards, after the complete deposition of the UU.) Zoom showing the boundary between the fold and the large diapir salt domains. Note the thickness variation within the UU (green), the almost constant thickness during phase 2 (yellow sequence) and the clearly thickness variations during phase 3 (blue sequence). An average velocity of 3,850 m/s (Leroux, 2012; Supplementary Data 1-2) is used to calculate a first order estimation of UU thickness. Encircled numbers indicate the salt tectonics phases: refer to text for more details.
(a) Profil sismique traversant le secteur nord-est du Bassin Provençal. (b) Zoom montrant les growth strata à partir du Pliocène inférieur, après le dépôt complet de l’UU. (c) Zoom montrant la frontière entre le Fold domain et celui de LDSD.
Current usage metrics show cumulative count of Article Views (full-text article views including HTML views, PDF and ePub downloads, according to the available data) and Abstracts Views on Vision4Press platform.
Data correspond to usage on the plateform after 2015. The current usage metrics is available 48-96 hours after online publication and is updated daily on week days.
Initial download of the metrics may take a while.