")
")
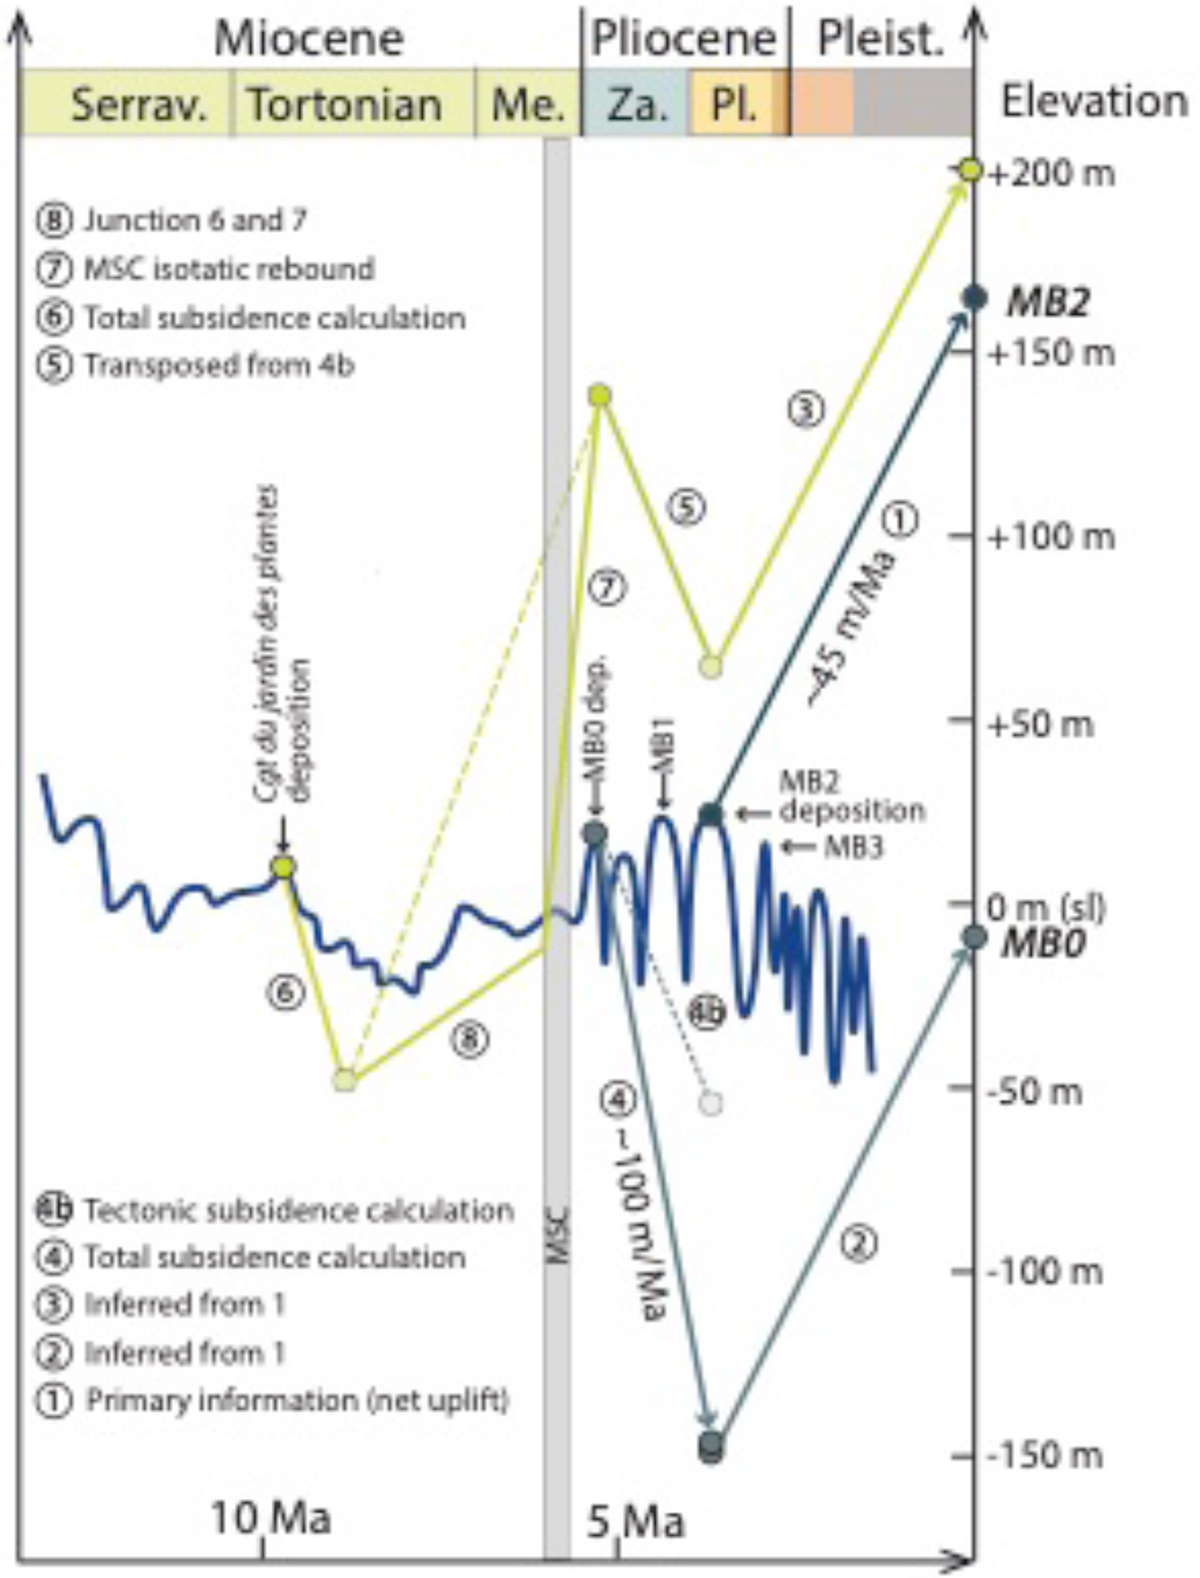
Fig. 10
Download original image
Geohistory analysis (depth vs time) for a number of Miocene and Pliocene remarkable stratigraphic markers around Lyon Metropolis. Used sea-level curve is the smoothed version of the detailed curve published in the same paper: Miller et al. (2020). Ages are from Figure 9. Calculations of subsidence and uplift magnitudes have been performed following the very usual subsidence analysis procedures (Angevine et al., 1990). Note the quasi perfect superimposition of the lowermost elevation of MB0 derived from the transposition of the uplift of MB2 (2) on the one hand, and from the calculation of the total subsidence of MB0 (4) on the other hand. The net uplift during the latest Miocene (dotted line), after the deposition of the Tortonian coastline Conglomérat du Jardin des plantes (David, 1979; Kalifi, 2020), has been inferred to be about 180 m. The Messinian incision has removed an average thickness of about 185 meters of Tortonian sediments (a very gross average between depths of the canyon and valley “wings”). The computation of the subsequent isostatic rebound gives a height of about 130 m, which makes up most of the total latest Miocene uplift.
Analyse géohistorique des profondeurs par rapport au temps des marqueurs stratigraphiques remarquables des environs de la métropole de Lyon.
Current usage metrics show cumulative count of Article Views (full-text article views including HTML views, PDF and ePub downloads, according to the available data) and Abstracts Views on Vision4Press platform.
Data correspond to usage on the plateform after 2015. The current usage metrics is available 48-96 hours after online publication and is updated daily on week days.
Initial download of the metrics may take a while.