")
")
Fig. 16
Download original image
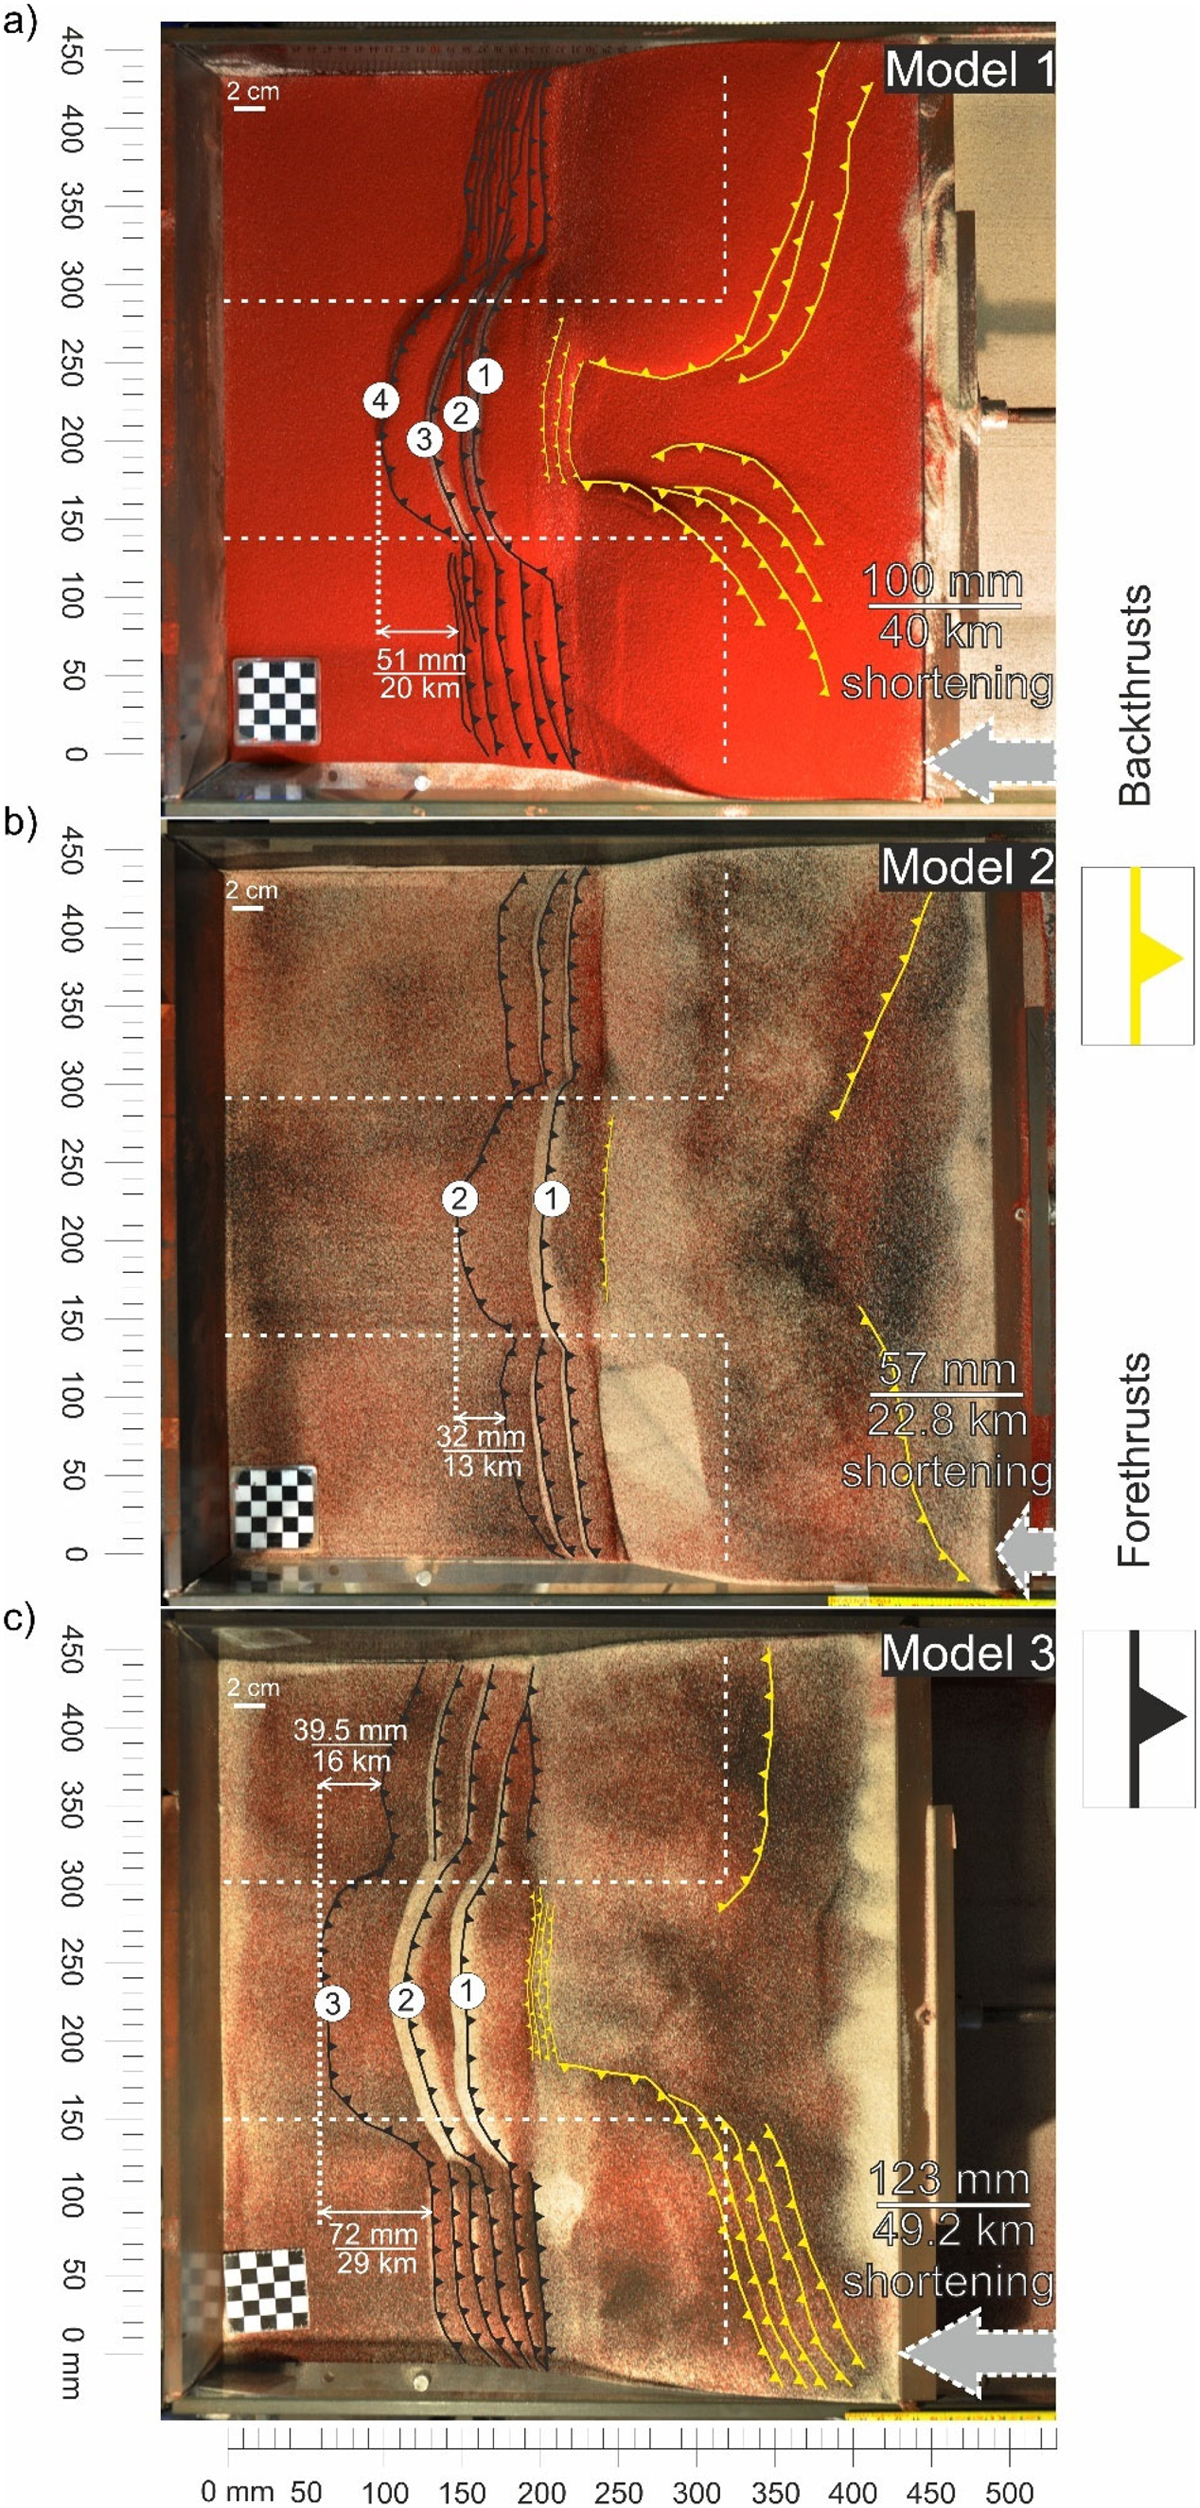
Interpreted top view photographs of the final states of all three experiments: in (a) model 1, in (b) model 2 and in (c) model 3. The white dashed lines indicate the four regions of the model (Fig. 12c). The black lines with chevrons follow the outcrops of forethrusts while the yellow lines indicate the outcropping backthrusts. Total shortenings are given at the bottom right and shown with large grey arrows. The checkerboards have 10 × 10 mm squares.
Photographies interprétées des états finaux des trois expériences : dans (a) modèle 1, dans (b) modèle 2 et dans (c) modèle 3. Les lignes tiretées blanches délimitent les quatre régions du modèle (Fig. 12c). Les lignes noires avec des chevrons indiquent les chevauchements et les lignes jaunes, les rétro-chevauchements. Les raccourcissements totaux sont indiqués en bas à droite et matérialisés par une grosse flèche grise. Les damiers ont des carrés de 10 × 10 mm.
Current usage metrics show cumulative count of Article Views (full-text article views including HTML views, PDF and ePub downloads, according to the available data) and Abstracts Views on Vision4Press platform.
Data correspond to usage on the plateform after 2015. The current usage metrics is available 48-96 hours after online publication and is updated daily on week days.
Initial download of the metrics may take a while.