")
")
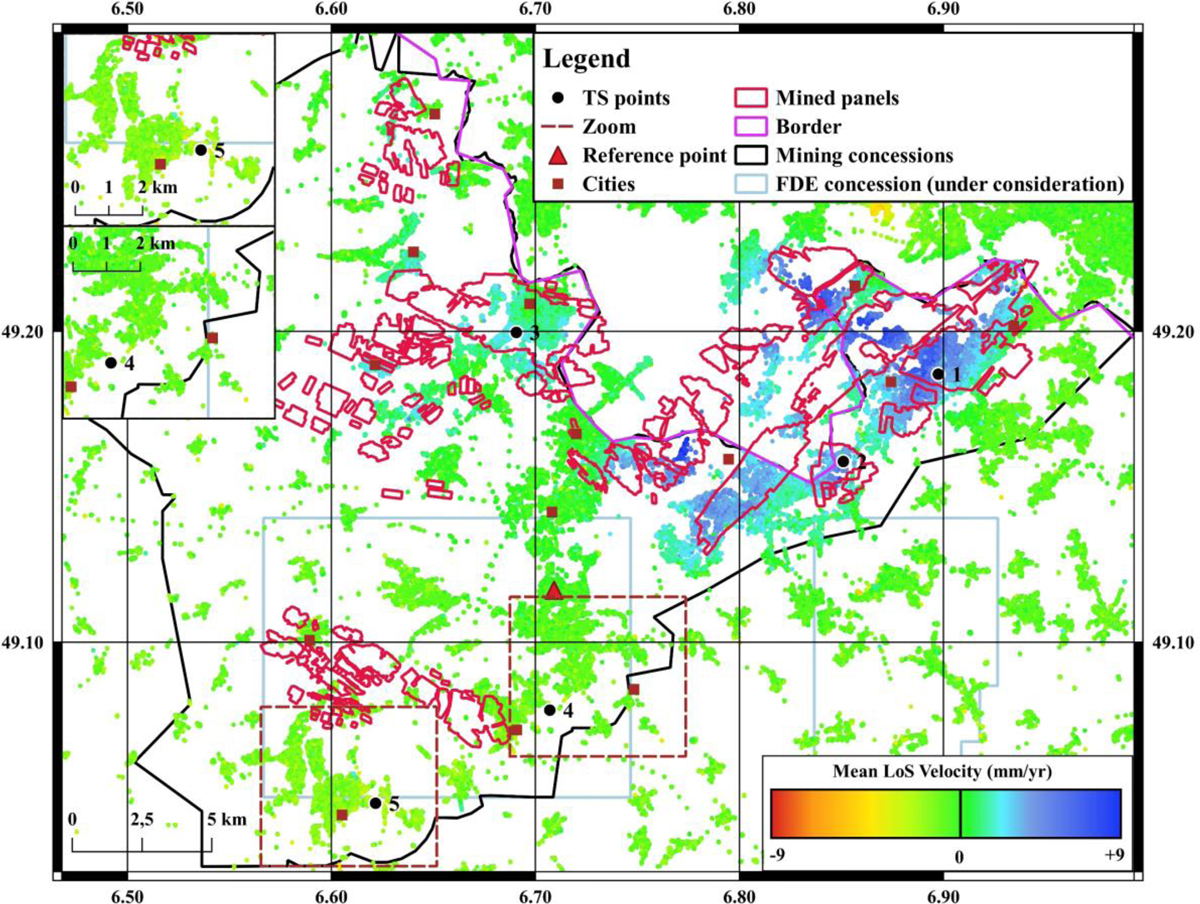
Fig. 3
Download original image
Mean LoS velocity map for the period from November 2014 to December 2019. The red triangle and black points indicate location of the reference point used for the PS-InSAR processing and where LoS displacement time series have been realized, respectively. The brown polygons represent the zoomed-in areas in the inserts on the left.
Carte de vitesses moyennes selon la ligne de visée du satellite sur la période de novembre 2014 à décembre 2019. Le triangle rouge et les points noirs indiquent la position du point de référence pour le traitement PS-InSAR et de déplacement, respectivement. Les polygones marron correspondent aux zones agrandies dans les encarts à gauche.
Current usage metrics show cumulative count of Article Views (full-text article views including HTML views, PDF and ePub downloads, according to the available data) and Abstracts Views on Vision4Press platform.
Data correspond to usage on the plateform after 2015. The current usage metrics is available 48-96 hours after online publication and is updated daily on week days.
Initial download of the metrics may take a while.