")
")
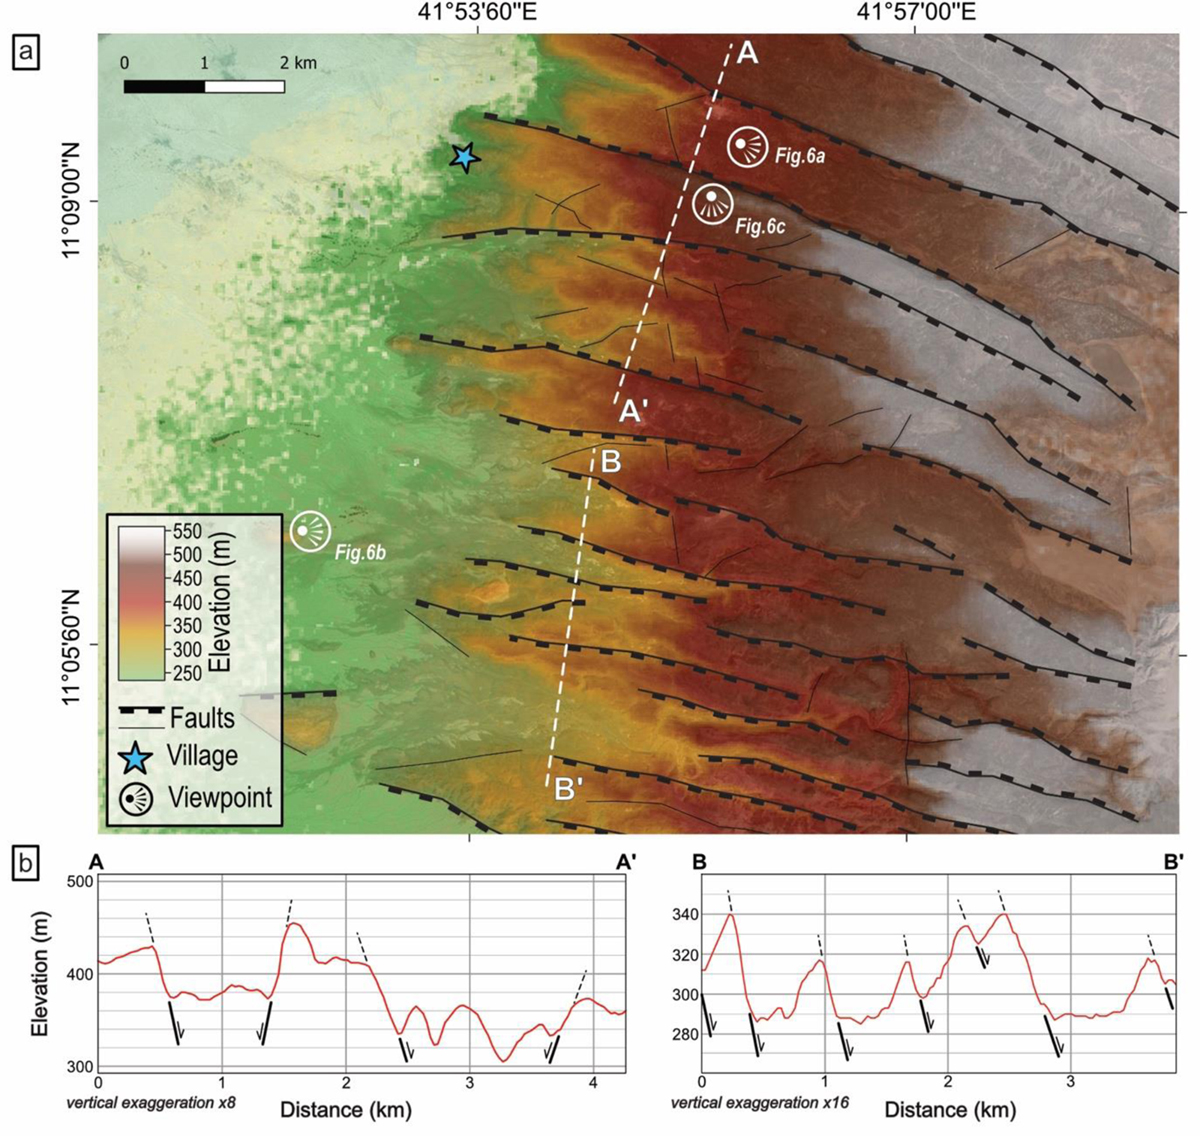
Fig. 5
Download original image
a) Topographic map of the LAGF area generated from SRTM Global DEM. White dashed lines are locations of topographic profiles represented in Figure 5b. Normal faults, interpreted from field and topography observations, and unresolved lineaments from 1/60,000 scale structural lineament mapping are shown as black lines. Viewpoint location of Figure 6 is shown on the map. b) Topographic profiles extracted SRTM Global DEM. Normal fault location is pointed out on the profiles.
Current usage metrics show cumulative count of Article Views (full-text article views including HTML views, PDF and ePub downloads, according to the available data) and Abstracts Views on Vision4Press platform.
Data correspond to usage on the plateform after 2015. The current usage metrics is available 48-96 hours after online publication and is updated daily on week days.
Initial download of the metrics may take a while.