")
")
| Issue |
BSGF - Earth Sci. Bull.
Volume 197, 2026
|
|
|---|---|---|
| Article Number | 7 | |
| Number of page(s) | 29 | |
| DOI | https://doi.org/10.1051/bsgf/2025024 | |
| Published online | 02 April 2026 | |
Control of lithospheric to crustal fault architecture on Cenozoic Rift geothermal systems (Upper Rhine, Bresse and Limagne, France)
Contrôle des failles de la lithosphère à la croûte dans le système géothermique du rift cénozoïque (Rhénan, Bressan et Limagne).
1
Biogéosciences UMR 6282, CNRS, Université Bourgogne Europe, 6 Boulevard Gabriel, 21000 Dijon, France
2
CVA ENGINEERING – 14 rue Coubertin, 21000 Dijon, France
3
Géosciences Montpellier, UMR 5243 CNRS, Université de Montpellier, 34090 Montpellier, France
4
BRGM, Direction des Affaires Territoriales de Bourgogne Franche Comté, 21000 Dijon, France
* Corresponding author: This email address is being protected from spambots. You need JavaScript enabled to view it.
Received:
17
October
2024
Accepted:
7
October
2025
Abstract
Hydrothermal groundwater systems are key to renewable energy due to their high thermal efficiency. Effective geothermal resources require not only a heat source but also permeable geological formations and appropriate flow patterns. Fault zones, play a critical role in this process, potentially acting as either drains or barriers. This study investigates the origins of heat flow in geothermal reservoirs by comparing the Bresse, Limagne, and Upper Rhine Grabens within the European Cenozoic Rift System (ECRIS), using a multidisciplinary approach to examine thermal properties, subsurface structure, and the role of fault zones in surface heat flow anomalies. Surface heat flow data from 943 points, geological maps, seismicity databases, and stress orientation data characterize crustal structures and fault networks, while seismic tomography, gravimetric maps, Moho and LAB depths, and SKS splitting measurements provide insights into mantle density variations, structural boundaries, and flow directions—together informing the model of heat distribution and high-temperature fluid migration.
This synthesis highlights different scale of heat flow anomalies above the continental average of 67 mW/m2: (i) a long-wavelength anomaly, (ii) three high-wavelength anomalies, and (iii) seven areas with very high-wavelength anomalies exceeding 175 mW/m2. High surface heat flow anomalies are linked to fault zones, such as the Sillon Houiller fault. In contrast, the long wavelength anomaly at the scale of the French Massif Central (FMC) is probably not linked to a lithospheric fault. Characterizing the lithosphere-asthenosphere architecture reveals that the long-wavelength thermal anomaly aligns with a thin lithosphere-crust corridor and a positive seismic velocity anomaly, indicating an increase in the mantle heat flux beneath the thin lithosphere of the FMC and the Rhine Graben. In Upper Rhine and Bresse Grabens areas, high crustal fault density network connecting with major lithospheric discontinuities often corresponds to high surface heat flow. The active and crustal faults (Sillon Houiller, La Marche, and Vittel) facilitate the upward migration of high temperature fluid. Finally, this study highlights the importance of integrating multidisciplinary methods to understand surface heat flow and its implications for geothermal energy.
Résumé
Les systèmes hydrothermaux souterrains jouent un rôle clé dans les énergies renouvelables en raison de leur haute efficacité thermique. Des ressources géothermiques efficaces nécessitent non seulement une source de chaleur, mais aussi des formations géologiques perméables et des schémas d’écoulement adaptés. Les zones de failles jouent un rôle crucial dans ce processus, pouvant agir soit comme drains, soit comme barrières. Cette étude examine l’origine du flux de chaleur dans les réservoirs géothermiques en comparant les grabens de Bresse, de Limagne et du Rhin supérieur, appartenant au Système de Rift Cénozoïque Européen (ECRIS), à l’aide d’une approche multidisciplinaire analysant les propriétés thermiques, la structure profonde et le rôle des zones de failles dans les anomalies de flux de chaleur en surface.
Les données de flux de chaleur issues de 943 points, les cartes géologiques, les bases de données sur la sismicité et les données d’orientation des contraintes permettent de caractériser les structures crustales et les réseaux de failles. Par contre, la tomographie sismique, les cartes gravimétriques, les profondeurs du Moho et de la LAB, ainsi que les mesures SKS apportent des informations sur les variations de densité du manteau, les limites structurales et les directions d’écoulement mantellique, contribuant ensemble à la modélisation de la distribution de la chaleur et de la migration des fluides à haute température.
Cette synthèse met en évidence différentes échelles d’anomalies de flux de chaleur supérieures à la moyenne continentale de 67 mW/m2 : (i) une anomalie de grande longueur d’onde, (ii) trois anomalies de longueur d’onde moyenne, et (iii) sept zones présentant des anomalies de très courte longueur d’onde dépassant 175 mW/m2. Les anomalies élevées de flux de chaleur en surface sont associées aux zones de failles, telles que la faille du Sillon Houiller. En revanche, l’anomalie de grande longueur d’onde à l’échelle du Massif Central français (MCF) ne semble pas liée à une faille lithosphérique. La caractérisation de l’architecture lithosphère-asthénosphère montre que cette anomalie thermique de grande échelle coïncide avec un corridor de lithosphère mince, une anomalie positive de vitesse sismique, et indique une augmentation du flux de chaleur mantellique sous la lithosphère amincie du MCF et du Graben du Rhin. Dans les régions des grabens du Rhin supérieur et de la Bresse, une densité élevée de failles crustales connectées à des discontinuités lithosphériques majeures correspond probablement à un flux de chaleur élevé en surface. Les failles crustales actives (Sillon Houiller, La Marche et Vittel) facilitent vraisemblablement la remontée de fluides à haute température.
Enfin, cette étude souligne l’importance d’intégrer des méthodes multidisciplinaires pour comprendre le flux de chaleur en surface et ses implications pour l’énergie géothermique.
Key words: Geothermy / heat flow / lithospheric faults / Variscan inheritage / Ecris
Mots clés : Géothermie / flux de chaleur / failles lithosphériques / héritage varisque / ECRIS
© I. Aubert et al., Published by EDP Sciences 2026
 This is an Open Access article distributed under the terms of the Creative Commons Attribution License (https://creativecommons.org/licenses/by/4.0), which permits unrestricted use, distribution, and reproduction in any medium, provided the original work is properly cited.
1 Introduction
Hydrothermal groundwater systems, with their high thermal efficiency, are a significant and reliable source of energy, offering the potential to play a crucial role in the transition to renewable energy (Duwiquet et al., 2020; Chen et al., 2021; Daniilidis et al., 2021; Marinković et al., 2023). Beyond the heat source, the thermal properties of geological formations, including their mineralogical composition (the intrinsic conductivity of minerals), heat capacity (mineral mass and bonding), and diffusivity (through a combination of texture, mineral phases, and porosity), and the drain properties of structural features, influence the development of geothermal resources (Ganguly and Mohan Kumar, 2012; Glaas et al., 2021; Jolie et al., 2021; Duwiquet, 2022; Duwiquet et al., 2022; Gudmundsson, 2022; Guillou-Frottier et al., 2024). Geothermal exploration relies on comprehending how geological features interact to control fluid flows and influence the geothermal resource location (Jolie et al., 2021; Duwiquet et al., 2022). Since flow patterns of hydrothermal fluids depend on hydraulic reservoir properties, a comprehensive understanding of reservoir structural (i.e., fault zones) and petrophysical properties is crucial (Gudmundsdottir and Horne, 2020; Daniilidis et al., 2021; Jolie et al., 2021; Duwiquet et al., 2022). Fault zones are discontinuities with a wide range of scale (i.e., crust and lithosphere (Watterson et al., 1996; Agosta et al., 2012; Vauchez et al., 2012; Choi et al., 2016). Variations in thermal conductivity can arise from the mineralogical composition of rocks(Clauser and Huenges, 1995; Kukkonen and Peltoniemi, 1998). In fault zones, diagenetic processes often lead to cementation by quartz and calcite (see Laubach et al. (2010) and references therein), two minerals with relatively high thermal conductivity, which can enhance heat transfer compared to the surrounding rock formations. Fault zones with their structural and diagenetic properties may locally modify the thermal regime, influencing heat distribution (Taillefer et al., 2017; Daniilidis et al., 2020; Aubert et al., 2021; Pederson et al., 2021; Zaal et al., 2021; Gudmundsson, 2022; Marinković et al., 2023; Guillou-Frottier et al., 2024).
In order to better understand the functioning of geothermal reservoirs, this study provides a synthesis on heat flow and its origins across a wide area including Centre and Northeast parts of France, Belgium, Luxembourg and Eastern Germany. This area includes various zones identified by the French Geological Survey (BRGM; Bureau de Recherches Géologiques et Minières) as potential deep geothermal resources, including the Paris Basin, the Limagne Graben, the Bresse Graben, and the Upper Rhine Graben (Fig. 1). The primary objective of this study is to identify the different parameters influencing the surface heat flow. To achieve this objective, a comprehensive, integrative multi-disciplinary, and multi-scale approach was adopted, encompassing the characterisation of structural properties (e.g., seismicity and fault connectivity), lithosphere and crustal internal structure (e.g., gravimetric maps and SKS), and heat flows (surface heat flow data and seismic tomography). These methodologies enabled us to identify high- surface heat flow areas and gain insights in the contributing factors to these zones.
 |
Fig. 1 A: Geological map of studied area (modified from the Europe − GISEurope − 1:1,500,000 scale − Bedrock Age; BRGM). The ante Triassic lithospheric discontinuities (dashed grey lines) are modified from Baptiste (2016). URG: Upper Rhine Graben, BG: Bresse Graben, LG: Limagne Graben, LRG : Lower Rhine (Roer Valley) Graben, PB: Paris Basin, PBMA : Paris Basin Magnetic Anomaly, AF: Ales Fault, AiF: Aigueperse Fault, ArF: Argentat Fault, AvF: Avallon Fault, BFF: Black Forest Fault, BF: Bray fault, CF: Cevennes Fault, CHF: Chantonnay Fault, CHoF: Cholet fault, DF: Durance Fault, DTF : Digne Thrust Front, JTF: Jura Thrust Front, LF: Loire Fault, LiF : Limagne Fault, LLF: Lalaye-Lubine fault, LRFS: Lower Rhine Fault System, LMF: La Marche Fault, LSF: La Serre Fault, MF: Marsanne Fault, MFZ: Midi Fault Zone, MzF : Metz fault, NASZ: North Armorican Shear Zone, NPF: North Pyrenees Fault, NSE : Nort-Sur-Edre fault, PBMA: Paris Basin Magnetic Anomaly, PF: Pilat Fault, PFT : Pennic Thrust Front, RBTZ: Rhine Bresse Transfer Zone, RF: Rhine Fault, SANSZ: South Armorican Northern Shear Zone, SASSZ: South Armorican Southern Shear Zone, SBTF : Subalpine Thrust Front, SeF: Seine Fault, SF: Sarre Fault, TF : Tonnerre fault, ValF: Valence Fault, VF: Vittel fault, SHF: Sillon Houiller, WRF: West Rhenan Fault. |
2 Geological settings
This study includes three regions with high geothermal potential: the Limagne, Bresse, and Upper Rhine Grabens (LG, BG and URG in Fig. 1). These grabens are related to the European Cenozoic Rift System (ECRIS), generating keen interest from industries in geothermal exploitation. This study will primarily concentrate on these grabens, exploring their characteristics and geodynamic developments in the subsequent section.
2.1 ECRIS grabens
The ECRIS, comprising several interlinked tectonic rifts, extends over a distance of 1100 km from the North Sea to the Mediterranean (Prodehl et al., 1992; Ziegler, 1992, 1994; Schumacher, 2002; Michon et al., 2003; Dèzes et al., 2004; Prodehl and Haak, 2006; Madritsch et al., 2009; Duringer et al., 2019; Frey et al., 2022; Jolivet et al., 2025).
The Upper Rhine Graben, extending 300 km in length and 30–40 km in width, is bordered by the Swiss Jura Mountains to the south and the Rhenish Massif, the Hesse Depression, and the Vogelsberg to the north (Fig. 1; Schumacher, 2002; Duringer et al., 2019; Frey et al., 2022)
The Limagne Graben, located in the northern part of the Massif Central, is limited by the Limagne fault and the Chaîne des Puys to the west, the Monts du Forez to the east, the Mont Dore and Cézallier massifs to the south, and opens to the north on the Paris Basin (Fig. 1; Wattinne, 2004; Calcagno et al., 2014).
The Bresse Graben, a N-S striking graben, with a length of 200 km and a width of maximum 60 km, is delimited by the Massif Central to the West, the Rhine-Bresse-Limagne Transfer Zone to the North (i.e., RBLTZ in Fig. 1), and the ‘Grande faille bordière’ normal fault system in the East (Fig. 1; Bois, 1991; Rocher et al., 2003; Jauffret et al., 2008;).
The structure of these three grabens is closely related to geodynamic events that occurred since the beginning of Cenozoic times. Under a variable regional stress-field, several phases of ECRIS development occurred from Paleocene to Pleistocene (Supplementary file 1).
2.2 Fault types
To understand the factors controlling the implementation of the geothermal system in the ECRIS grabens, a broader scale of distribution of structural accidents linked to the geothermal reservoir needs to be taken into account. The study area covers numerous fault zones from the lithosphere to the upper crust. In this study, three types of faults have been distinguished based on their sizes, depths, and geodynamic contexts: lithospheric, and two types of crustal faults (rift and transfer) as defined below (Fig. 1).
2.2.1 Lithospheric faults
The term ‘Lithospheric fault’ (bold grey segments in Fig. 1) refers to a ‘wrench fault type’ (i.e., sub-vertical faults with horizontal motion direction; Moody and Hill, 1956), that affects the entire lithosphere and is rooted in the upper mantle (Vauchez and Tommasi, 2003; Vauchez et al., 2012). These fault zones can reach hundreds of kilometres in length and tens of kilometres in width (Herquel et al., 1999; Vauchez and Tommasi, 2003; Titus et al., 2007; Platt and Behr, 2011; Vauchez et al., 2012). Below the brittle-ductile transition, the differential displacement along these faults localizes in a zone of continuous deformation dominated by simple shear (Vauchez et al., 2012).
In the studied area, the lithospheric faults result from the reactivation of major (i) Cadomian and (ii) Variscan collisional structures. (i) The Cadomian orogeny, occurred from Late Proterozoic to Early Cambrian (Dupret et al., 1990; Linnemann et al., 2008, 2014; Beucler et al., 2021) and is visible mainly in Variscides Massifs (i.e., Armorican, Bohemian, and Iberian; Linnemann et al., 2014). This orogen was related to an important subduction zone located on the northern and active paleomargin of the Gondwana supercontinent (Chantraine et al., 2001; Ballèvre et al., 2009; Beucler et al., 2021; Mazur et al., 2026). Nowadays, only a single Cadomian suture zone remains, as the South Armorican Northern Shear Zone lithospheric fault (SASNZ in Fig. 1; Beucler et al., 2021). (ii) The Variscan orogeny, is related to an NW-SE directed Variscan convergence between the Silurian and the Early Devonian (Schäfer et al., 2000; Matte, 2001; Kroner et al., 2008). This convergence led to the drift of Gondwana and Laurussia continents (McCann et al., 2006), to the Rheic subduction, and finally, to the Variscan orogeny ca. 430Ma (Kroner and Romer, 2013). The Variscan area recorded sinistral and dextral strike-slip tectonic (Kroner and Romer, 2013). At the end of the Variscan orogenic period, the upper crust exhibited notable heterogeneity (i.e., lithospheric faults, suture zones, NE sinistral wrench zones), marked by collisional fabrics observed from the base of the crust to the lithospheric mantle (Schumacher, 2002; Judenherc et al., 2003; Edel et al., 2018; Dezayes and Lerouge, 2019; Beucler et al., 2021). The Variscan orogen in France displays marked lithospheric heterogeneity, resulting from the accretion of compositionally diverse continents and terranes during continental collision, followed by crustal and lithospheric thinning that facilitated the exhumation of subcontinental mantle (Arthaud and Matte, 1975; Guillou-Frottier et al., 2024; Mazur et al., 2026).
Some of these lithospheric faults are prominent and illustrated in Figure 1 as in the Armorican Massif (e.g., the South Armorican Southern Shear Zone lithospheric fault and the Nort-sur-Edre fault located on the Eo-Variscan suture zone; Beucler et al., 2021), in the Massif Central (e.g., the Sillon Houllier fault; and the La Marche fault; Joly et al., 2007, 2008), and in the Paris Basin (e.g., the Bray and Vittel fault located on the Rheic suture zone; Beucler et al., 2021). This Variscan structural trend will later impinge the Permo-Carboniferous trough structures.
Numerous lithospheric faults, such as the Avalon and Seine faults, have a profound impact on the crust and lithosphere’s structure, influencing both gravitational signatures and magnetic signals (Baptiste, 2016). These major discontinuities are directly linked to terranes involved in the Late Paleozoic Variscan orogeny (Kroner and Romer, 2013; Chardon et al., 2020; Beucler et al., 2021; Mouthereau et al., 2021; Mazur et al., 2026). Indeed, they delineate (e.g., Bray Fault, Nort-Sur-Edre fault, Tonnerre Fault, Sillon Houiller fault) and cross-cut (e.g., Avallon Fault, Loire Fault) these terranes (Fig. 1; Baptiste, 2016; Chardon et al., 2020; Beucler et al., 2021; Mouthereau et al., 2021). The Variscan orogenic period led to the development of such important heterogeneities (i.e., lithospheric faults, suture zones, and NE sinistral wrench zones) as South Armorican Southern Shear Zone lithospheric, Nort-sur-Edre, Sillon Houllier, La Marche, Bray and Vittel faults; (Schumacher, 2002; Judenherc et al., 2003; Joly et al., 2007, 2008; Edel et al., 2018; Dezayes and Lerouge, 2019; Beucler et al., 2021).
2.2.2 ECRIS crustal faults
Two types of crustal faults are considered in this study: (i) rift faults and (ii) transfer faults
(i) Rift faults (green segments in Fig. 1) Rift faults accommodate continental extension at the crustal scale (Bonini et al., 2005; Muirhead et al., 2019; Ojo et al., 2022). Faults in rift systems can be divided into border faults and intra-rift faults (Corti, 2009; Ojo et al., 2022). Here, the term “rift faults” refers to border faults of rift basins. This fault type, delimiting one or both side of a rift segment (Lavayssière et al., 2019; Muirhead et al., 2019; Ojo et al., 2022), presents a width ranging from few centimetres to tens of meters (Neuharth et al., 2022). Border faults frequently accommodate the majority of offset (McLeod et al., 2000; Bell et al., 2014; Hodge et al., 2018; Henstra et al., 2019; Lavayssière et al., 2019; Muirhead et al., 2019).
(ii) Transfer faults (dashed red segments in Fig. 1) are subvertical faults linking normal fault segments associated to rift systems. They typically have a strike-slip motion and mainly strike parallel to the extension direction (Gibbs, 1990; Faulds et al., 1998; Peacock et al., 2000; Acocella et al., 2005). These faults adjust displacement and deformation to accommodate movement between two crustal domains with differential extension or form a lateral boundary to an extended terrane (Faulds et al., 1998; Acocella et al., 2005; Liu et al., 2022). Transfer faults can be synthetic or antithetic if they are connecting normal fault systems with respectively similar or opposite dip direction (Faulds et al., 1998). Location of transfer faults can be controlled by pre-existing basement shear zones (Chorowicz, 1992; Smith and Mosley, 1993; Ring, 1994; Muirhead and Kattenhorn, 2018). These faults are widespread and have been described at various extensional settings (e.g., the Atlantic margin of W Africa, Namibia, and Brazil; see Acocella et al. (2005) and references therein).
In the context of this study, the ECRIS rift and transfer faults developed through the tensional and transtensionnal reactivation of inherited Paleozoic and Mesozoic crustal discontinuities (Bergerat, 1977; Lacombe et al., 1993; Merle and Michon, 2001; Sissingh, 2001; Schumacher, 2002; Dèzes et al., 2004; Giamboni et al., 2004; Ziegler and Dèzes, 2005; Edel et al., 2007; Madritsch et al., 2009). The Mesozoic rifting slightly affected the studied area (Ziegler et al., 2004, 2006). In the Bresse and in the Upper Rhine Grabens, this extensional event led to a minor reactivation of Paleozoic faults (Lemoine, 1985; Durlet et al., 1997; Jacquin and de Graciansky, 1998; Quesne et al., 2000).
2.2.3 The Rhine-Bresse-Limagne transfer zone
The NE-SW Rhine-Bresse-Limagne transfer zone connects the "en échelon"-arranged Rhine, Bresse and Limagne rift segments (URG, BG and LG in Fig. 1; Ustaszewski et al. (2005), Zwaan and Schreurs (2017)). Many authors have proposed that the Priabonian to Oligocene crustal extension responsible for the opening of the Rhine and Bresse-Limagne Grabens was transferred along the RBLTZ by transtensive sinistral reactivation of an ENE-WSW Variscan basement fault system (Illies, 1972; Contini and Theobald, 1974; Bergerat, 1977; Bergerat and Chorowicz, 1981; Lacombe et al., 1993; Madritsch, 2008; Madritsch et al., 2009). The RBLTZ corresponds to the eastern extension of the Variscan South Armorican shear suture zone running through southern Britanny to the northern Massif Central defined by Matte (2001) and Chardon et al. (2020). RBLTZ is supposed to have accommodated the differential extension rate between the ECRIS rift segments during Early Cenozoic times. The left-lateral displacement along the RBLTZ is also consistent with a Priabonian pulse of sedimentation predating mid-Oligocene extensional tectonics (Sissingh, 1998; Séranne et al., 2021).
3 Methods
In order to define the structural, internal structure and thermal (i.e., heat flows) properties of the study area at various scales, a multidisciplinary approach using numerous methods and databases was conducted (Fig. 2).
Three imbricated space scales are considered:
Thousand km scale: This scale (latitudes 40°N–52°N and longitudes 5°W–14°E) highlights large-scale and low-frequency factors (i.e., mantle and lithospheric processes). It was used with methods and data from seismic tomography (part 5), Lithosphere-Asthenosphere Boundary (LAB) depth (part 5), Mohorovičić discontinuity (Moho) depth (part 5), gravimetric maps (part 5), and SKS splitting measurements (part 6). This scale is ideal for studying low-frequency heat anomalies.
Rhine-Bresse-Limagne area: This scale (latitudes 44°N to the South and 52°N to the North, and longitudes 1°E to the West and 10°E to the East) is used to define the surface heat flow data (part 4), stress orientation map (part 7), and seismicity (part 7). It is ideal for studying surface heat flow.
Small scale: This scale focuses on superficial crustal processes (surface fault network) and very high-wavelenght heat flow anomalies. Two zoomed-in frameworks of the main study area were considered, named Upper Rhine Graben (latitudes 47.8°N–48.9°N and longitudes 5.3°W–7.7°E) and Bresse (latitudes 46.7°N–47.8°N and longitudes 3.6°W–6°E), spanning 180 km from East to West and 120 km from North to South (part 7).
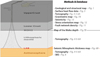 |
Fig. 2 Different methods and database used with their corresponding earth layers. Illustration of a large-scale lithospheric shear zone is modified from Vauchez and Tommasi (2003). |
3.1 Characterisation of heat flows
Surface heat flow data. To determine the geological features influencing the distribution of heat flow patterns, a heat flow map was generated using 943 points of the Global Heat Flow data base (Fuchs et al., 2023). This database of the International Heat Flow Commission (IHFC; www.ihfc-iugg.org) − International Association of Seismology and Physics of the Earth’s Interior (IASPEI) is a compilation of data generated between 1939 and 2022. In this study, only the data included in the main area of interest were considered (Lat 44°N–52°N and Ln 1°E–10°E). To define and analyse the spatial characteristics of the Heat flow data, a contour map was realised using the kriging method with the SURFER 15.4.354 software (Fig. 3, production of American Golden Software Company (AGSC)). The spatial correlation of the kriging interpolation was characterized using a quadratic variogram model with a scale parameter of 0.8 and a correlation length (A) of 2.5. The model exhibits an error variance (nugget effect) of 0.35, indicating a moderate level of spatial variability at small scales, while the micro-variance remains negligible (0). The anisotropy ratio is 1.0, with an anisotropy angle of 0°, suggesting an isotropic spatial structure. The variogram is presented in Supplementary file 1. An uncertainty map was generated alongside the interpolation using Kriging, providing a quantitative assessment of the interpolation reliability. This map helps refine the definition of anomalies by highlighting areas with higher uncertainty. this contour map is also available in Supplementary file 2.
Seismic tomography. Seismic tomography is a valuable tool for imaging Earth’s internal structure and heat flow, as it reveals variations in crust and mantle properties such as temperature and chemical composition (Cammarano et al., 2005; Schmandt and Humphreys, 2010; Hosseini et al., 2018; Civiero et al., 2019; Tenzer and Chen, 2019). In this study, seismic tomography maps and cross-sections were generated using the SubMachine web-based tools (Hosseini et al., 2018), employing a depth-restricted model (Hosseini, 2016) and an equidistant cylindrical projection. Three tomography depth-slices (lat. 40°N to 52°N and ln. 5°W to 11.5°E) at depths of 20 km, 70 km and 140 km have been constructed (Fig. 4A). These depths were selected to image temperature in the crust, lithosphere, and asthenosphere, considering Moho and LAB depths defined by Mouthereau et al. (2021). Four tomography cross-sections were produced to analyse the three-dimensional spatial arrangement of temperature under Limagne, Upper Rhine, and Bresse Grabens (Fig. 4B, C). The Hosseini et al. (2018) model included in our analysis, is based on Vp and derived from teleseismic body waves with subvertical ray paths beneath the seismic stations. As a result, variations in crustal thickness can affect this model in the upper 150 km, making the interpretation of thermal anomalies above 100 km depth more challenging. To improve our understanding of deep Earth structures and better constrain thermal anomalies, four additional Vs models: SEMUCB-WM1 (French and Romanowicz, 2014), SEMUlm (Lekić and Romanowicz, 2011), GyPSuM-S (Simmons et al., 2010), and Savani (Auer et al., 2014) have been incorporated. These models offer a complementary perspective by reconstructing the velocity structure of the upper 100 km of the Earth, which in turn helps to infer the thermal structure of the crust and upper mantle.
 |
Fig. 3 Interpolated maps of surface heat flow data. A: modified from Lucazeau and Vasseur (1989), and B: interpolated from The Global Heat Flow Database: Update 2023. For more details on heat flow data extrapolation, see Annexe 1. The white dashed lines correspond to the heat zone contours, thick and thin dashed line correspond respectively to large-scale and small-scale heat flow anomaly. LFHZ : Low Frequency Heat zone, SHHZ: Sillon Houiller Heat Zone, BHZ: Burgundy Heat Zone, URHZ: Upper Rhine Heat Zone. |
3.2 Characterisation of upper mantle and crustal structure
Gravimetric maps. Gravimetric maps were used to characterise gravity anomalies associated with Earth’s internal density structures. Two maps (N80W60 and N80E0) sourced from Sandwell et al. (2014) using satellite-derived free-air gravity anomalies with an accuracy of approximately 2 mGal. These anomalies were derived from satellite altimetry data, primarily from missions such as CryoSat-2, Jason-1, and Envisat, to map variations in Earth’s gravity field (Sandwell et al., 2014).
Mohorovicic discontinuity (Moho) and Lithosphere-Asthenosphere Boundary (LAB) Depths. The depth (in km) of the Moho has been defined after Cloetingh et al. (2007) and the depth of the LAB (i.e., seismic lithospheric thickness) was deduced from the global model LITHO1.0 (Pasyanos et al., 2014).
TheSKS splitting measurements. SKS were used to constrain deformation in the crust and mantle. The orientation of fast split S-waves serves as an indicator of the mantle flow direction and can also offer proof of the major lithospheric fault zones (Sieminski et al., 2008; Vauchez et al., 2012; Tommasi and Vauchez, 2015; Bonnin et al., 2017; Jolivet et al., 2020). In this study, the size and orientation of the SKS phases were considered to determine the direction and extent of mantle anisotropy. Here, the SKS splitting parameters are a compilation of SKS measurements made in previous studies from Bormann et al. (1993), Vinnik et al. (1994), Judenherc et al. (2003), Barruol et al. (2004), Walker et al. (2005), Bokelmann et al. (2013), Walther et al. (2014), and Bonnin et al. (2017).
3.3 Characterisation of structural fabrics
Geological maps. The location and type of various faults in this study, as well as the sutures lines of terranes, were defined through the examination of geological and structural maps (1:1000 000) from Chantraine et al. (2003) and bibliographic references (i.e., Chardon et al., 2020; Mazzotti et al., 2020; Beucler et al., 2021; Mouthereau et al., 2021; Ritz et al., 2021).
Seismicity. Three different databases were considered to characterise the seismicity over a period from 463 to 2021: (1) The French seismic Catalogue (FCAT-17) catalogue for the historical seismicity from 463 to 1962 (Manchuel et al., 2018), integrating the SisFrance database (BRGM, EDF, IRSN) defined with the MSK-64 intensity scale (Medvedev et al., 1965). (2) The Instrumental Seismicity Catalogue covering the period 1962–2021 from the Si-Hex catalogue (1962–2009) provided with the moment magnitude Mw (Cara et al., 2015) completed by the BCSF-Rénass catalogue from 2010 (https://www.franceseisme.fr/sismicite.html). (3) The Focal Mechanism Database FMHex20 of RESIF including earthquakes with magnitude Mw≥4.0, sourced from Mazzotti et al. (2021). In this study, only the focal mechanisms, with a depth ≥20 km (Si-Hex localisation), a quality index of A or B, and a Mw≥3 is considered. The neotectonics database compiles information available for faults located within a 50 km radius around nuclear facilities. Traces of potentially active faults were obtained through the BDFA Database (IRSN; Jomard et al., 2017). For each fault, the last period of activity is indicated: Syn- to Post- Late Miocene, Syn- to Post- Pliocene, Quaternary, or undetermined. Earthquake’s density is illustrated.
Stress orientation map and fault network connectivity. For a better understanding of subsurface fault networks, two factors have been considered: the maximum horizontal stress (SHmax) and the fault network connectivity. The maximum horizontal stress (SHmax), from the WSM database (see Heidbach et al., 2018), is derived from borehole breakouts, focal mechanisms, hydraulic fractures, and drilling-induced fractures. The 2-D relationship between surface heat flow and fault network connectivity has been studied in two areas of interest using the 1:50,000 structural map (BRGM). Each fault network is modelled as a combination of nodes and branches. The connecting nodes represent points where intersecting faults connect or abut. These nodes were used to create kernel density maps with a 10 km cell size resolution using ArcGIS.
4 Surface heat flow
Two distinct thermal anomalies are raised from the analysis of Figure 3B: (1) a long-wavelength anomaly (LFHZ) and (2) high- wavelength anomalies (Sillon Houiller Heat Zone (SHHZ), Burgundy Heat Zone (BHZ), and Upper Rhine Heat Zone (URHZ) in Fig. 3B). (1) The long-wavelength anomaly (LFHZ) is oriented approximately N065°, with a maximum width of ∼330 km and a length exceeding the map size (i.e., ∼780 km in the same orientation). (2) The high-wavelength anomalies [Sillon Houiller Heat Zone, Burgundy Heat Zone and Upper Rhine Heat Zone] are longer than wide, ranging from ∼240 to ∼450 km, with a maximum width of ∼100 km. These anomalies aligned along a N000°–N020° orientation. In addition to its main N000°–N020° direction, the Burgundy Heat Zone (BHZ) exhibits a N060°–N070° striking heat anomaly axis that aligns with the RBLTZ transfer fault (Figs. 1 and 3B). Several warmer areas within these Heat Zones are noteworthy: (1) a very high-heat flow zone (more than 170 mW/m2) in the URHZ (named (a) in Fig. 3B), (2) a heat zone exceeding 155 mW/m2 superposed on the Sillon Houiller fault zone (named (b) Fig. 3B), (3) a slightly higher heat flow zone north of the SHHZ (named (c) in Fig. 3B), and (4) two higher heat flow zones in the western part of the BHZ (named (d) in Fig. 3B). Two areas with low surface heat flow stand out: the Alps and, more generally, north of the LFHZ anomaly.
However, aside from the Massif Central, the Cenozoic volcanic zones do not currently exhibit high surface heat flows (Fig. 3B). The surface heat flow map provides a current representation, showing that although these volcanic zones were active during the Cenozoic, there is minimal or no residual heat from their past activity at the surface. Notably, some volcanic patches are positioned along or at the intersections of major fault zones, including lithospheric and transfer faults (Fig. 3). The heat flow is localized in the Massif Central near major rift faults, particularly the Sillon Houiller fault, where associated volcanic activity makes it difficult to separate the respective contributions of magmatic heat transfer and hydrothermal fluid circulation.
Anomalously high surface heat flow values can result from different factors, including intrinsic thermal and hydraulic properties of rocks (thermal conductivity, heat production, porosity, permeability, ...). By considering the thermal conductivity values provided by Clauser et al. (1995) and the basement lithologies mapped by (Baptiste, 2016; see Supplementary file 3 and 4), the thermal conductivity is associated with heterogeneous-scale lithological units. This complex architecture of conductivity anomalies does not coincide with the medium- to large-scale thermal conductivities (Fig. 3). Given this misalignment, these high heat flow zones are unlikely to result from lithological conductivity variations alone.
5 Characterisation of lithosphere-asthenosphere architecture
5.1 Large scale lithospheric heterogeneities
Three tomography depth slice maps and cross-sections were examined in order to delineate upper mantle structures (Fig. 4). The seismic tomography depth slice maps reveal seismic velocity anomalies: positive anomaly centered on N France and S England, and negative anomaly running from the Germany to E Spain across SE France Fig. 4A). These anomalies exhibit similar shapes, suggesting consistent properties through the crust and lithosphere (Figs. 4A and 5). These anomalies are also visible at lower depth (20 km and 70 km; Supplementary file 5) with S-Wave model (SEMUCB-WM1, GyPSuM-S, and Savani).
The positive Seismic velocity anomaly, denoted as (a) in Figures 4 and 5, is characterised by seismic velocity anomaly (dv/v) exceeding 0.85% and extending to depths of approximately ∼410 km (visible on cross-sections 1 and 3 of Fig. 4B, 4C). This anomaly overlaps with a terrane assemblage outlined by Baptiste (2016): The Armorican domain (North and Central), the Ligerian domain, the Cadomian domain, the Paris Basin Magnetic anomaly (PBMA in Figs. 1 and 6A), the Seine block, the Evry-Tonnerre block, the Morvan-Vosges block, the Sarre block, and the Ardennes-Pays de Bray block (Fig. 6A). The boundaries of the positive seismic velocity anomaly (a) (Fig. 4) approximately align with the southern limits of these terranes. Most of these terranes (excepted the Morvan-Vosges, Sarre, and Ardennes-Pays de Bray blocks) have been described as “Armorica” in several studies detailing the positions of Variscan terranes in Europe (e.g., Matte, 2001; Ziegler et al., 2004; Franke et al., 2017; Chardon et al., 2020; Mouthereau et al., 2021;). The seismic tomography depth-slice at 140 km (Fig. 6A) clearly illustrates the overlap between the boundary of seismic velocity anomalies (above and below 0.85%) and the localization of the Nort-Sur-Edre fault and South Armorican Northern Shear Zone (SANSZ-NSE) lithospheric faults and the RBLTZ transfer fault (Fig. 1). The LAB depth map from Pasyanos et al. (2014, Litho 1.0 model) reveals notably deep lithosphere-asthenosphere boundaries beneath the Armorican and Cadomian domains, exceeding 100 km and reaching over 200 km in the northwest (Fig. 6B). This range of depths under these terranes corresponds to depths provided by Mouthereau et al. (2021).
The second anomaly (b) in Figures 4 and 5, exhibits seismic velocity anomaly (dv/v) lower than −0.85% and can reach depths exceeding 410 km (visible on the three cross-sections of Fig. 4C). This anomaly is globally oriented N045°. This localisation is associated with low depth LAB with depths predominantly remaining below 100 km and possibly diving below 50 km. This LAB depth above 50 km is visible notably, in the Bresse Graben and the southern section of the Limagne Graben (Fig. 6B). Anomaly (b) does not extend beyond a depth of 500 km and does not seem to be directly linked to a deeper seismic anomaly. Sections 1 and 2 indicate that the b anomaly is dipping toward the NNW.
A positive seismic velocity anomaly (dv/v) mostly >0.5% (c), with high seismic velocities (cross sections 1 and 2 in Fig. 4C) can be observed in the SE part of the area at depth >140 km.
Gravity anomalies are superposed on the trace of inherited Variscan domain bordered by significant faults (Fig. 7A). The regional gravity low aligns with the Variscan internal zone and the reworked northern Gondwana hyperextended margin. Toward the south, it is bounded by an even more pronounced negative anomaly associated with the Alpine front. Such gravity lows typically reflect substantial crustal thickness, reduced crustal density, or a combination of both (Mazur et al., 2026). These anomalies are marked by a succession of axes exhibiting positive gravity anomalies (> −5 mGal) and negative anomalies (< −13 mGal). Several of these anomalies are aligned with lithospheric fault zones (Fig. 7A). For instance, anomalies striking N130° correspond to the Bray and Seine faults, those striking N045° correspond to the Sarre, Tonnerre, and Metz discontinuities, and finally, anomalies striking N100° to N120° correspond to significant Armorican discontinuities as South Armorican Northern Shear Zone, Nort-Sur-Edre, Cholet, and Chantonnay Faults (Fig. 7A). These gravity anomalies, linked to lithospheric fault zones, are correlated with magnetic signatures (Fig. II.7 in Baptiste, 2016; Mazur et al., 2026). However, the most prominent magnetic anomaly in the region remains concentrated in the area encompassing the Seine and PBMA faults, known as PBMA. This anomaly is attributed to the presence of intermediate to acidic plutonic rocks, such as diorites/granodiorites, and granites (Baptiste, 2016). A long-wavelength-gravity anomaly is located above a domain limited by the PBMA and BF (Fig. 7A), corresponding to the Seine, the Evry-Tonnerre block and the Ardenne-Pays de Bray blocks (in Baptiste, 2016; Fig. 7A).
 |
Fig. 4 P-wave seismic tomography images centred on Upper Rhine, Bresse and Limagne Grabens (lat. 40°N to 52°N and ln. 5°W to 11.5°E, based on P-Wave model (Hosseini, 2016; Hosseini et al., 2018), A: Tomography depth-slices at depths of 20 km, 70 km and 140 km, B: Simplified map of tomography warm and cold spots. The high surface heat flow patches of Figure 3B are also reported. The lines identified with the numbers (i.e., 1, 2 and 3) represent the profiles of the sections showed in C. C: 2-D tomography cross-sections at latitude of 48, longitude of 5, and 2 diagonals passing through ECRIS rifts (cross-sections 1 and 3). The depths of the dashed lines are 410, 660, 1000 km from the surface. NAPBD: North Armorica Paris Basin Domain, RBLTZ: Rhine-Bresse-Limagne Transfer zone, NED: North ECRIS domain, SED: South ECRIS Domain. |
 |
Fig. 5 S-wave seismic tomography depth-slices at depths of 140 km based on four different S-Wave models: A: SEMUCB-WM1 (French and Romanowicz, 2014), B: GyPSuM-S (Simmons et al., 2010), C: SEMUlm (Lekić and Romanowicz, 2011), and D: Savani (Auer et al., 2014). |
 |
Fig. 6 Lithosphere- asthenosphere properties of the studied area. A: Tomography depth-slice at depth of 140 km (based on P-Wave model, Hosseini et al., 2018), NAPBD. North Armorica Paris Basin Domain, RBLTZ. Rhine-Bresse-Limagne Transfer zone, NED. North ECRIS domain, SED. South ECRIS Domain. B: Depth of the LAB Lithosphere-Asthenosphere Boundary (i.e., seismic lithosphere thickness) modified from the global model LITHO1.0 (Pasyanos et al., 2014). The high surface heat flow areas are defined from Figure 3B, NAPBD: North Armorica Paris Basin Domain, RBLTZ: Rhine-Bresse-Limagne Transfer zone, NED: North ECRIS domain, SED: South ECRIS Domain |
 |
Fig. 7 A: Gravimetry anomalies after the N80W60 and N80E0 gravimetry maps of Sandwell et al. (2014). B: Depth (km) of the Mohorovicic discontinuity modified after Cloetingh et al. (2007). The high surface heat flow areas are defined from Figure 3B. LDCR: Low-Depth Crustal Region, URG: Upper Rhine Graben, BG: Bresse Graben, LG: Limagne Grabens, LRG: Lower Rhine (Roer Valley) Graben, NAPBD. North Armorica Paris Basin Domain, RBLTZ. Rhine-Bresse-Limagne Transfer zone, NED. North ECRIS domain, SED. South ECRIS Domain. B: Depth of the LAB AvF: Avallon Fault, BF: Bray fault, CHF: Chantonnay Fault, CHoF: Cholet fault, MzF: Metz fault, NASZ: North Armorican Shear Zone, NSE: Nort-Sur-Edre fault, SANSZ: South Armorican Northern Shear Zone, SeF: Seine Fault, SF: Sarre Fault, TF: Tonnerre fault, VF: Vittel fault, NAPBD. North Armorica Paris Basin Domain, RBLTZ. Rhine-Bresse-Limagne Transfer zone, NED. North ECRIS domain, SED. South ECRIS Domain. |
5.2 Large scale crustal heterogeneities
To improve understanding of crustal structures—including density heterogeneities and deformation patterns—this study analyzes Moho depth, gravimetric, and magnetic anomaly maps from Baptiste (2016) across the study area (Fig. 7).
The gravimetric map using satellite-derived free-air gravity anomalies with an accuracy of approximately 2 mGal. reveals multiple gravity anomalies linked to crust and upper mantle density structures, which are classified into three distinct groups based on their characteristics (Fig. 7A). (a) Anomalies related to ECRIS rifts. These anomalies, located in the Limagne, Bresse, and Upper Rhine basins, exhibit negative gravity values, generally ranging from 0 to −29 mGal (Fig. 7A). The most negative values (i.e., −29 mGal) are found in the northern part of the Upper Rhine Graben-related anomaly (Fig. 7A). The negative gravity anomalies may be linked to the low-density infills within the rifts. (b) Anomalies related to Variscan massifs. These positive to very positive (up to 70 mGal) anomalies are located in the area of Massif Central, Armorican Massif, Vosges, Black Forest Massif, and Rhenish Massif. However, the Armorican Massif and the edges of the Massif Central show lower anomaly values (ranging between −5 and 37 mGal; Fig. 7A).
The depth map of the Mohorovicic Discontinuity (Moho) illustrates variations in crustal thickness (Fig. 7B). This map highlights a region characterised by relatively thin crust, identified in this study as the Low-Depth Crustal Region (LDCR). The LDCR is predominantly oriented at N050°, spanning approximately ∼150 km to ∼280 km in width and exceeding 760 km in length. Within the LDCR, the Moho depth ranges from 32 to 24 km. The LDCR is found at the border of the Alpine massif. The depths fall below 24 km under the Limagne Graben and the Upper Rhine Graben (labelled as (a) and (b), respectively, in Fig. 7B). The Bresse graben presents a Moho depth mostly below 28 km (Fig. 7B). The Armorican Massif is characterised by a thicker crust and a minimum Moho depth of 32 km.
The integration of tomographic data, lithospheric and crustal thicknesses and gravimetry allows the characterization of two areas limited by the Rhine-Bresse-Limagne Transfer Zone (Fig. 1):
A northern Brittany-Paris Basin domain marked by a thick lithosphere and crust, negative gravimetric anomalies (NAPB in Fig. 4, 6A, B and 7A, B). This domain corresponds to the southern Variscan Armorica terrane (Matte, 2001; Dèzes et al., 2004; Franke et al., 2017; Chardon et al., 2020; Mouthereau et al., 2021).
A southern area characterized by a thin lithosphere and crust, positive and negative stepped-arranged gravimetric anomalies (NED and SED in Figs. 4, 6A, B and 7A, B). This domain is specified as a peri-Gondwanan terrane by Mouthereau et al. (2021). For a complementary discussion of the relative impacts of the Variscan and Alpine cycle on these structures, see (Mazur et al., 2026).
6 Control of lithospheric architecture and mantle flow on large scale heat flow anomaly
6.1 Distribution of SKS data in the French continental domain
SKS shear-wave splitting measurements in the Massif Central reveal marked upper mantle seismic anisotropy, indicating large-scale asthenospheric flow. The dominant NW–SE fast directions (Fig. 8), distinct from Hercynian structures align with Tertiary extension (Barruol et al., 2004). This pattern results from the rollback of the Tethys slab and the rotation of the Corsica–Sardinia block during the opening of the western Mediterranean (Barruol et al., 2004; Bonnin et al., 2017). The continuity of anisotropy into the Alps suggests a regional asthenospheric flow diverted by deep lithospheric structures like the Alpine roots. In the final stages of the Tethys, a low-viscosity mantle flow, aligned with the absolute motion of Africa and Eurasia before 35 Ma, propagated northward, generating a long-lived topographic anomaly (Fig. 24 in Jolivet et al., 2025). This flow, along with slab retreat in the Liguro-Provençal Basin, contributed to the formation of the ECRIS, evolving from transtensional rifting (∼until 32 Ma) to pure extension in the Early Miocene.
However, seismic splitting measurements across some South France domains reveal a complex lithospheric architecture shaped by ancient tectonic processes (Fig. 8, A-B-E). Shear wave splitting in the Armorican and Central massifs as well in the Pyrenees reveals both lithospheric and asthenospheric contributions to anisotropy:
(1) Armorican and Central Massifs (a and e in Fig. 8, A-E in Fig. 9): SKS predominantly strike at N140°–150° in the Armorican Massif, located in Western France, as described by Judenherc et al. (2003) and strike at N110–120° to N20° in the Central Massif (Babuška et al., 2002). In the southern part of the Armorican Massif, splitting measurements identify anisotropy aligned with major crustal shear zones (e.g., South Armorican Southern Shear Zone and Chantonnay Fault), supporting a model of juxtaposed lithospheric blocks assembled before the Hercynian orogeny (Judenherc et al., 2003). In the Central massif, the fast polarization directions and delay times from SKS splitting define three coherent lithospheric domains and a deep mantle suture that parallels major Variscan lithospheric faults and associated crustal faults (Sillon Houiller, the southern prolongation of the South Armorican shear zones), indicating that fossil anisotropic fabrics inherited from the Variscan orogeny are preserved in the mantle lithosphere and in the crust (Babuška et al., 2002; Barruol et al., 2004). These observations illustrate the concept of lithospheric transcurrent faults in which major crustal faults broaden downward forming large-scale shear zones in the lithospheric mantle and acting as potentiel mantle-surface pathway (Leloup et al., 1995; Teyssier and Tikoff, 1998; Vauchez and Tommasi, 2003).
(2) Pyrenees (b in Fig. 8): SKS strike in two directions: N060° and N100° in the Pyrenees of Southwest France, as documented by Bonnin et al. (2017). Abrupt changes in splitting parameters correspond to transitions between tectonic domains, with evidence for both frozen-in Hercynian N60° fabrics (e.g., Cevennes Faults) and more recent N100° mantle flow related to western Mediterranean dynamics.
(3) Southeast France (c in Fig. 8): SKS predominantly strike between N100° and N145° in Southeast France, based on data from Barruol et al. (2004) and Bokelmann et al. (2013). The SKS directions are linked to asthenospheric flow associated with the Mediterranean slab retreat (Barruol et al., 2004; Jolivet et al., 2021, 2025).
(4) Eastern Alps (d in Fig. 8): SKS under the Eastern Alps exhibit an orientation ranging from N000° to N030°, as described by Bokelmann et al. (2013).
Splitting measurements in southern France consistently demonstrate that seismic anisotropy is controlled by both inherited variscan lithospheric and crustal fabrics and ongoing asthenospheric flow. The lithospheric architecture is marked by deep sutures and reactivated faults, providing a detailed image of the region’s tectonic evolution (Granet et al., 2000; Barruol et al., 2004).
 |
Fig. 8 Compilation of SKS splitting data. Red: measurements from Barruol et al. (2004), dark blue: measurements from Bokelmann et al. (2013), purple: measurements from Bonnin et al. (2017), pink: measurements from Bormann et al. (1993), brown: measurements from Judenherc et al. (2003), green: measurements from Vinnik et al. (1994), light blue: measurements from (Walker et al. (2005), orange: measurements from Walther et al. (2014). SKS splitting data have good lateral but poor vertical resolution and constrain the upper mantle anisotropy (Wüstefeld et al., 2009; Vauchez et al., 2012; Tommasi and Vauchez, 2015). The high surface heat flow areas are defined from Figure 3B. |
 |
Fig. 9 Components of sub-crustal topographical support and surface heat flow on a Brittany-Southern Subalpine Chaîne section (location in Figs. 1, 3, 4AB, 6, 7 and 11A). A) topographic data from source etopo 1: http://www.ndgc.noaa.gov/mgg/fl (from Faccenna and Becker (2020), and Stephenson et al. (2024) and B) dynamic topography (From Faccenna and Becker, 2020), C) Gravity anomaly data from Sandwell et al. (2014), D) surface heat flow data (modified from Lucazeau and Vasseur (1989) and interpolated from The Global Heat Flow Database: Update 2023). Note the superposition of the Rhine-Bresse-Limagne transfer zone (RBLTZ) and the small-scale heat flow anomaly suggesting that RBLTZ is a lithospheric fault zone connecting surface and mantle, E) lithopheric thickness modified from (Pasyanos et al., 2014). The RBLTZ-Massif Central domain is limited to west by the thick-lithosphere of Armorican and it corresponds to a corridor of thin lithosphere associated with upper mantle upwelling and probably edge driven convection, F) P-wave seismic tomography section. The depths of the dashed lines are 410 and 660 km from the surface. |
6.2 The NE-SW thin lithosphere corridor and its northern frontier: the Rhine Bresse Limagne Transfer Zone
Topography is considered to be controlled by the isostasic effects of crustal thickness and density variations (Airy, 1855; Henry Pratt, 1855). However, it is also clear that the density structure of the lithospheric and sub-lithospheric mantle contributes to the altitude of the Earth’s surface (Jordan, 1978; McKenzie, 1978; Bird, 1979; Hager and Richards, 1989). To estimate the contribution of active mantle flow, a NW-SE transect from Brittany to the southeastern Alps (locations shown in Figs. 1, 3, 5A, B, 6A, B, 8, and 9A) is constructed by integrating actual and residual topographies, gravity anomalies, surface heat flow data, lithospheric thickness, and tomographic anomalies (A to F in Fig. 9). This integrated analysis provides a powerful way to discriminate between the contributions of mantle, crustal and surfaces processes and to characterize the proxies for sub-crustal topographical support. Residual topography is defined to be the component of topography that is left after subtraction of the isostatic component of the lithosphere from the actual topography (Faccenna and Becker, 2020; Hoggard et al., 2021; Stephenson et al., 2024). Dynamic topography is specified as the deflection of the earth s’ surface due to active mantle flow (Ricard et al., 1993); it corresponds to any topography supported by sub-crustal processes (Forte et al., 1993; Faccenna and Becker, 2020).
The Armorican massif and the southern Paris Basin are characterized by low actual topography, neutral residual and dynamic topographies (< 300 m; Faccenna and Becker, 2020; Stephenson et al., 2024) as well as low gravity anomaly values (< 30 mGal; Sandwell et al., 2014; A to D in Fig. 9). This domain is related to the thick-lithosphere Armorica terrane (LAB ≤ 200 km, e in Fig. 8, Pasyanos et al. (2014)). It is also associated with a high-velocity zone of seismic waves (F in Fig. 9, Hosseini, 2016; Hosseini et al., 2018).
In contrast, the Massif Central and the ECRIS Limagne Graben show positive residual topography (up to 1200 m, b in Fig. 10; Faccenna and Becker, 2020; Stephenson et al., 2024), positive dynamic topography of the order of 600 m (b in Fig. 8, Faccenna and Becker, 2020). These proxies highlight a sub-crustal topographical support and suggest an origin of the Massif Central uplift in the mantle in association with the positive gravity anomalies marking the Cenozoic volcanism (up to 60 mGal, c in Fig. 8). The Massif Central area is characterized by a thin lithospheric thickness around 50 km (e in Fig. 8, Pasyanos et al., 2014) and low-velocity zone of seismic waves imaged between 0 to 150 km (F in Fig. 9, Hosseini, 2016; Hosseini et al., 2018). Small “baby” upper mantle plumes have been described below the Massif Central (Granet et al., 1995; 2000; Sobolev et al., 1996; Goes et al., 1999) responsible for topographic doming at the surface and sustained volcanism (Ritter et al., 2001). Integration of dynamic topography, gravity anomalies and the presence of mafic magmatic rocks indicate that the Massif Central and ECRIS basins lithosphere is anomalously thin and the sub-plate mantle may be anomalously warm in this region (Lucazeau et al., 1984; Ziegler, 1992; Artemieva, 2019; Stephenson et al., 2024).
Assuming that the anisotropy comes from a low-viscosity asthenosphere, we use the shear-wave splitting data compilation (c and e in Fig. 8) together with geological and geophysical information (Figs. 9A and 10) to assess the direction of the mantle flow. These data image a low-velocity thin-lithosphere N065° corridor in the uppermost mantle and asthenosphere (E in Fig. 9). This elongated channel of thin and weak lithosphere directly influences the surface topography and the emplacement of the Massif Central volcanism. It is characterized at asthenospheric depths by NW-oriented SKS reflecting N140–110° asthenospheric flow and it clearly channelizes beneath area of thinned crust (Fig. 8A). The N65°corridor of thinned crust and lithosphere is limited to the north by the Rhine Bresse Limagne transfer zone (RBLTZ in Fig. 10A). It probably corresponds to the northern prolongation of the asthenospheric finger related to the Moroccan hot line (Mouthereau et al., 2021; Jolivet et al., 2022).
 |
Fig. 10 Characterization of the upper mantle flows. A: Synthetic map considering the Moho depth, the LAB depth, the tomography anomalies, the high surface temperature, the SKS splitting data and the location of lithospheric and transfer faults. B: Schematic illustration of Oligocene to present mantle flow (modified from Jolivet et al., 2022). C: Mantle flow upwellings related to the Calabrian slab (modified from Faccenna et al., 2010). |
6.3 Large scale heat flow anomaly: Cenozoic West Mediterranean back-arc extension and ECRIS rifting
The European continental domain is characterised by a large zone of low heat flow associated with shields (Lucazeau, 2019). The analysis of surface heat flow in this study has revealed three types of positive anomalies (Fig. 3) exceeding the average continental heat flow of 67 mW/m2 (Lucazeau, 2019): (i) a long-wavelength anomaly (LHFZ), (ii) three high-wavelength anomalies (SHHZ, BHZ, and URHZ in Fig. 3B), and (iii) seven zones of very high-wavelength anomalies (flux >175 mW/m2). Notably, the long-wavelength surface heat flow anomaly (>120 mW/m2) trends roughly N55°E, as illustrated in Figure 3, coinciding with the northern boundary of the thin lithosphere-crust corridor (Figs. 9A and 10) and with a positive seismic velocity anomaly (labeled “b” in Figs. 4A, B, C and 6).
This overlap between long-wavelength thermal anomalies and positive seismic velocity anomalies suggests a potential increased mantle heat flux beneath this region. Further insights are provided by seismic velocity maps and cross-sections, which reveal the structure of the upper mantle.
In addition to these seismic anomalies, the fast NW-SE SKS azimuths in the studied zone align with the stretching direction of the western Mediterranean back-arc basins, reflecting a 30–15 Ma period of back-arc extension (Jolivet et al., 2009; Faccenna et al., 2014; Fig. 10A, B). The associated NW-SE mantle flow, driven by the Cenozoic retreat of the Calabria slab over 800 km in the western Mediterranean, has been well documented by Carminati et al. (1998), Jolivet et al. (2009), Faccenna et al. (2014), and Romagny et al. (2020).
The thin crust-lithosphere corridor and thermal weakening observed in the northern and southern ECRIS domains (NED and SED in Figs. 6A, B, 7B, and 9A) are thought to have been initiated during the Cenozoic back-arc extension of the western Mediterranean, linked to the significant retreat of the NW-slab. Together, these features suggest that the Massif Central was a key site of slab retreat and mantle flow, playing a central role in the reorganization of lithospheric deformation during the Tertiary. However, an alternative interpretation to explain the observed lithospheric thinning emphasizes the specific role of the Variscan French Massif Central. Crustal and lithospheric mantle thickness data, combined with gravity anomalies, highlight this region as experiencing during Variscan orogeny significant lithospheric thinning, north-directed subduction, and gravitational collapse. Despite later modifications, the thin lithosphere beneath the Variscan internal zone is interpreted as a remnant of the original Variscan architecture (Mazur et al., 2026). The thin crust-lithosphere corridor and the thermal weakening observed in the northern and southern ECRIS domains (NED and SED in Figs. 6AB, 7B, and 9A) are thought to have been initiated during the Cenozoic back-arc extension of the western Mediterranean, associated with the significant retreat of the NW-slab. The accumulation of cold material at the 660 km Transition Zone related to the downward pull of the Alpine lithospheric slab would have also triggered small-scale mantle upwelling (Fig. 9C; Sobolev et al., 1996; Goes et al., 1999; Merle and Michon, 2001; Piromallo et al., 2001, 2008; Piromallo and Faccenna, 2004; Tommasi and Vauchez, 2015; El‐Sharkawy et al., 2020; Jolivet et al., 2021; Rappisi et al., 2022). This top-down processes could also explain the Massif central Cenozoic volcanism (Meyer and Foulger, 2007; Piromallo et al., 2008; Faccenna et al., 2010). In this context, localized mantle upwellings such as those identified through seismic tomography may be induced by mechanisms such as edge-driven convection or slab-triggered plumes (Piromallo et al., 2008). The Variscan and Cadomian terranes (e.g., the Armorican, Ligerian domain and Cadomian domains) act as a resistant entity, impeding the flow of mantle upwelling and diverting it towards the periphery of the North Armorica Paris Basin block (NAPBD in Figs. 6A, 9D).
Finally, numerical models of mantle convection suggest that asthenosphere-lithosphere coupling may result in NE-SW recent compression (15 to 0 Ma) in most areas of France (Faccenna and Becker, 2010; Faccenna et al., 2014). This ongoing compression likely plays a role in the dynamic uplift of the Massif Central and in shaping the region’s large-scale surface heat flow patterns (Figs. 3 and 9A, C).
However, a contribution from crustal heat flow to the surface heat flow cannot be ruled out. Indeed, Lucazeau et al. (1984) and Duwiquet et al. (2019), in a study focused on crustal faults in the Massif Central, demonstrated that crustal heat flow could account for up to 26% of the total surface heat flux. Nevertheless, these values remain significantly lower than those associated with mantle-derived heat flow. In the context of our study, we consider the crustal contribution to be relatively minor, due to the highly heterogeneous lithology of the region (see Supplementary file 3; (Baptiste, 2016)) − dominated by sedimentary formations
Therefore, we interpret the observed surface heat flow as being primarily controlled by two main processes: (1) asthenospheric flow, and (2) small-scale mantle upwelling, likely related to the accumulation of cold material from the Calabrian Alpine Slab near the 660 km transition zone.
6.4 Heat flow anomaly and lithospheric faults
The lithospheric faults detected in the study area would thus facilitate upward movement of heat and development of the surface heat flow anomalies (Fig. 9).
Therefore, these major discontinuities are expected to create a significant anisotropy in thermicity within the lithospheric mantle. This result in faster heat flow parallel to the discontinuities and slower heat flow perpendicular to the discontinuities, allowing the heat flow to rise in the upper crust (Pili et al., 1997; Italiano et al., 2000; Vauchez and Tommasi, 2003). These concepts are supported by the location of the highest anomaly in surface heat flow (up to 150 mW/m2, D in Fig. 9), in the vicinity of the Rhine Bresse Limagne transfer fault zone (RBLTZ in Figs. 9A and 10).
6.5 Heat flow anomaly and crustal faults
Lithospheric faults are linked to the surface through a network of crustal faults, which can facilitate the circulation of geothermal fluids and lead to mineral precipitation (Bourcier et al., 2005; Vauchez et al., 2012; Regenspurg et al., 2015). Fault intersections, characterized by a dense fracture network and high connectivity, favour environments conducive to high-temperature geothermal systems (Faulds et al., 2006; 2012; Faulds and Hinz, 2015; Duwiquet, 2022). Thus, the connectivity of fault zones plays a crucial role in geothermal systems.
The analysis of fault densities in Figure 11 identifies two sectors of interest presenting dense fault networks (these zones are situated in Fig. 10A).
Zones (1) (Upper Rhine Graben), and (2) (Bresse), are characterised by high to very surface heat flow (>120 mW/m2) and fault density, and both sectors exhibit a significant density of faults. To further define the impact of fault network density on surface heat flux in detail, these two zones have been subjected to a more detail analysis, considering the 1/50,000 scale structural map (BRGM; see Figs. 11A, B).
Zone (1) includes a portion of the Upper Rhine Graben and associated deformations, as well as several notable faults such as the Lalaye-Lubine fault (LLF), the Nomény fault (NF), the Sainte-Marie-aux-Mines Retournemer fault (SMF), the Tignécourt Fault (TiF), the Vittel fault (VF), and the Vosges fault (VoF). It also encompasses the northeastern part of the Rhine Bresse Transfer Zone (Fig. 11A). This zone presents 3270 connecting nodes. High-connecting nodes density zones are aligned along a N060° axis, superimposed to the transverse fault network of the RBTZ (cluster 2 in Fig. 11A). An increase of connecting node density can be noticed at the intersection of the N060° axis and the shoulders of the Upper Rhine Graben (n = 2219; cluster 1 Fig. 11A). Moreover, node densities also increase at intersections between Upper Rhine Graben related deformation and other major faults (Fig. 11A) such as Lalaye-Lubine fault (n = 227), Sainte-Marie-aux-Mines fault (n = 140), and Vosges Fault (n = 860). Overall, there is an increase in connecting node density along the Vosges Fault. In this zone, there are two N000°-N020°-striking high surface heat flow anomalies ((a) and (b) Fig. 11A) with the most important heat flow area located in the northern part of the studied zone (b). The cluster 1 visible on the edges of the Upper Rhine Graben overlaps with the eastern anomaly (Fig. 11A). The two main very high surface heat flow patches are located in the northern part of (a) and (b) (Fig. 11A). The northern part of (a) presents, however, a relatively low density of connecting nodes (n = 21).
Zone (2) includes the northern parts of Bresse. This area comprises several notable faults: the Avallon fault (AvF), the Toulon-sur-Arroux le Creusot fault (ToF), the Monceau-les-Mines fault (MMF), the La Serre fault (LSF), and the Jura thrust fault (JTF) (Fig. 11B). The zone also cross-cut the southwestern part of the Rhine Bresse Limagne transfer zone (RBLTZ; Fig. 11B). Zone (2), with 3270 referred nodes is the denser one, three clusters of connecting nodes are visible in this area (clusters 1 to 3 in Fig. 11B). Most connecting nodes (n = 1526) align along an N020° axis, on the Bresse Graben shoulders (cluster 1 in Fig. 11B). This N020° direction corresponds to the orientation of Bresse Graben rifting faults. In the N020°-striking cluster 1, node density increases at intersections between NNE-SSW and ENE-WSW faults (e.g., faults in the Mâlain, Saussy, and Vernot sectors; Fig. 11B). Three high-density connecting node zones are also visible northeast of Zone (2) and correspond to cluster 2, located at the southern and northern RBTZ boundaries (Fig. 11B). Cluster 3 is a high-density connecting node zone in the southeast can be associated with deformation related to the Limagne Graben (Fig. 11B). In this area, the heat flow anomaly aligns along two axes: N060°–N070° and N000°–N020°. The northern part of cluster 2 overlaps the N060°–N070°-striking high heat flow axis and is partially encompassed within the very high surface heat flow (b) (Fig. 11B). The N000°–N020° anomaly, aligns perfectly with the connecting node clusters corresponding to the edge of the Bresse Graben (Cluster 1 Fig. 11B). Only the northern part of cluster 3 is included within a high surface heat flow zone (Fig. 11B). The area of very high surface heat flow (a) is not correlated with a high density of fault intersections; rather, it is located along the Avallon Fault (Fig. 11B), a connection between the high fault densities and the very high surface heat flow can be established. The fluid circulations related to the high connectivity zones may have led to the cementation of fault zones with thermally conductive minerals(Clauser and Huenges, 1995) such as calcite (λ: 4.2–5.0), silica (λ: 6.5–11.3), magnetite (λ: 9.7), or fluorite (λ: 10.1). Such mineralization could partially explain the high surface heat flow values observed.
The role of crustal faults in explaining surface heat flow anomalies is described by Duwiquet et al. (2019), who emphasize the importance of porosity during the mineralization of fault zones.
 |
Fig. 11 Two specific areas of interest showing the interaction between the fault network connectivity and the heat flow. A: the south Upper-Rhine Graben sector, B: northern parts of Bresse Graben The black dashed lines delineate areas of interest described in section 6.5. AuF: Autun Fault, AvF: Avallon Fault, EF: Epinal Fault, JTF: Jura Thrust Fault, LLF: Lalaye-Lubine fault, LSF: La Serre Fault, MMF: Montceau-les-mines Fault, NF: Nomény Fault, RBTZ: Rhine Bresse transfer zone, SF: Sarre Fault, SMF: Ste. Marie-aux-Mines-Retournemer Fault, TF: Tonnerre Fault, TiF: Tignécourt Fault, ToF: Toulon-sur-Arroux-le Creusot Fault, VF: Vittel Fault, VoF: Vosges Fault, VolF: Vologne Fault. |
7 Perspectives on crustal faults and geothermal systems
Geothermal systems are strongly controlled by crustal faults that display specific geometric and mechanical properties, including damaged zones thicker than 100 m, displacements of at least 100–150 m, and kilometer-scale lengths (Guillou-Frottier et al., 2024). When lithospheric faults extend into the upper crust, they facilitate fluid flow and heat transfer, thus sustaining geothermal activity at shallow depths.
Tectonic stresses are fundamental for maintaining permeability within fault zones, as they drive fluid circulation and keep fractures open (McLellan et al., 2004; Rowland and Sibson, 2004; Cox et al., 2012; Armandine Les Landes et al., 2019; Taillefer et al., 2021; Duwiquet et al., 2022; Guillou-Frottier et al., 2024). Significant changes in tectonic settings influence geothermal system parameters such as temperature and flow rates (Cox et al., 2012; Taillefer et al., 2021; Guillou-Frottier et al., 2024). Favourably oriented tectonic stresses within deformation zones may sustain permeability and keep fractures open (Curewitz and Karson, 1997; Guillou-Frottier et al., 2024). Strike-slip regimes are particularly favorable for fluid movement, as shown in zones such as La Marche, Bresse Graben, and the Upper Rhine Graben (Guillou-Frottier et al., 2024). Active faults identified by seismicity (over 40,000 earthquakes) coincide with areas of thermal and mineral springs, confirming their role as conduits for heat and fluid flow (Manchuel et al., 2018; Cara et al., 2015).
Stress regimes and maximum horizontal stress (SHmax) orientations were determined from borehole breakouts, focal mechanisms, hydraulic fractures, and drilling-induced fractures (Fig. 12; Heidbach et al., 2018). In the Sillon Houiller zone, stresses are generally NW-SE to NNE-SSW, with all three regimes represented. In the Bresse Graben, SHmax is oriented N-S and linked to strike-slip faulting, while in the Upper Rhine Graben, SHmax orientations range from N-S to NW-SE, also encompassing all stress regimes. Strike-slip orientations are especially favorable for geothermal upwellings. For example, the La Marche fault exhibits orientations at 30° and 70° to SHmax, consistent with the presence of thermal and mineral springs (Duwiquet et al., 2021; 2022; Guillou-Frottier et al., 2024). Similarly, favorable stress alignments explain thermal and mineral springs along the Avallon, Tonnerre, and Vittel faults (Fig. 14).
Where lithospheric faults do not directly reach the surface, interconnected crustal fault networks govern heat transfer efficiency, longevity, and flow rates. Their permeability depends on architecture, rock and fracture properties, depth, stress conditions, tectonic regime, and geometry (Ingebritsen and Gleeson, 2017; Taillefer et al., 2018; Wanner et al., 2019; Guillou-Frottier et al., 2020; 2024; Alt-Epping et al., 2021).
Geothermal systems are predominantly linked with active faults, as seismic activity enhances permeability and indicates potential pathways for fluid circulation (Faulds et al., 2010; Siler et al., 2018; Louis et al., 2019; Duwiquet, 2022; Guillou-Frottier et al., 2024). In the studied area, more than 40,000 earthquakes have been recorded, including 4,178 historical events (FCAT-17 catalogue; SisFrance database) and 37,351 instrumental events (SI-Hex database, 1962–2021), with only 20 exceeding Mw ≥ 4 (Manchuel et al., 2018; Cara et al., 2015). About 12,666 earthquakes occurred at depths of 10–30 km (Fig. 13), mainly in the external Alps.
Important discontinuities associated with springs and high heat flow, such as the La Marche, Sillon Houiller, Loire, Vittel, and Toulon-sur-Arroux–le Creusot fault zones, are considered active (Fig. 14). However, macroseismicity alone does not ensure permeability preservation; a favorable stress regime is essential for sustaining fluid flows (Barton et al., 1995; Guillou-Frottier et al., 2024).
 |
Fig. 12 Correlation between the stress orientation / regime and the surface heat flow. Stress orientation map of the studied area is based on WSM database; (Heidbach et al., 2018), the colours and the length of the symbol indicate respectively the stress regime and the quality of stress measurements. |
 |
Fig. 13 A: Map of historical (triangles) and instrumental seismicity (rounds), with their respective intensity and magnitudes. Grey round points correspond to historical seismicity sourced from the FCAT-17 (Manchuel et al., 2018) catalogue integrating the SisFrance earthquakes database [SisFrance, BRGM, EDF, IRSN (2023)], while other round points represent data from Instrumental Seismicity Catalogue covers from the Si-Hex project (Cara et al., 2015). B: Depth and focal mechanisms of the seism. Depth of seismicity is from SisFrance earthquakes database (https://www.sisfrance.net/), and the selected focal mechanism sourced from Mazzotti et al. (2021). Traces of potentially active faults were obtained through the BDFA Database (IRSN). |
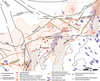 |
Fig. 14 Synthetic map showing lithospheric faults, localstrike-slip stress orientations, fault activity, surface heat flow distributions, and the occurrence of thermal and mineral springs. |
8 Conclusion
This multidisciplinary approach highlights the importance of integrating multiple tools and methods to better understand the heat flow observed at the surface, which is crucial for identifying areas favorable for geothermal energy. Through a multi-scale analysis (tomography, SKS, seismic lithospheric thickness map, moho depth, gravimetric map, fault network density and surface heat flow data), this study has enabled a more precise visualisation of structural heterogeneities at different depths, from the lithosphere to the surface, and their potential link with the heat flows.
This highlights the following conclusions: The origin of heat flow in the Earth’s crust can be attributed to two main processes: (1) asthenospheric flow and (2) small-scale mantle upwelling, which is linked to the accumulation of cold material from the Calabrian Alpine Slab at the 660 km transition zone. These mantle dynamics, which influence heat transfer over tens to hundreds of millions of years, continue to impact present-day temperatures and surface heat flow. However, a contribution from crustal heat flow should not be ruled out, even if it appears to be relatively minor. The interaction between mantle flows and lithospheric faults drives the upward movement of heat. The major discontinuities corresponding to lithospheric faults and the networks of mineralized crustal faults are the vectors of heat flow towards the surface. These vectors lead to localized heat flow anomalies at the surface. The crustal fault network helps to understand the distribution of localized heat flow at the surface when connected to lithospheric and mineralized faults, as it can conduct the heat transfer. However, it also plays a role when the faults are open. Indeed, well oriented active crustal faults allow the transfer of potentially hot fluids to the surface. Strike-slip stress regimes, in particular, are most conducive to fluid upwellings. The orientation of maximum horizontal strike-slip stress around areas with high heat flow can promote significant upward movement of geothermal fluids, as observed in fault zones such as the Vittel and Tonnerre faults. The increased density of thermal and mineral springs at the junctions of lithospheric fault zones and crustal network is in line with a higher potential for geothermal systems.
Acknowledgments
This work is a contribution from the SEDS team in the Biogéosciences Laboratory (UBE, Dijon, France). We would like to thank the CNRS for funding the ANR-21-PRRD-0001-01 project as part of the French government’s recovery plan.We also extend our thanks to the company INGEN (F. Smektala) for their valuable contribution to this study. We are grateful to the reviewers for their valuable comments that helped improve the manuscript. We also thank the Editors, Pr Olivier Vanderhaeghe and Pr Laurent Jolivet, for their guidance and support.
Supplementary Material
Supplementary file 1. Table summarizing the tectonic and volcanic events that occurred during the major geodynamic events associated with the European Cenozoic Rift System.
Supplementary file 2. Interpolated contour map of surface heat flow data from Figure 1 with the related variogram, and uncertainty map generated during the interpolation using Kriging.
Supplementary file 3. Geological map of the Paris Basin pre-Mesozoic basement (from Baptiste, 2016) associated to the surface heat flow and the thermal conductivity of rocks (from Clauser and Huenges, 1995).
Supplementary file 4. Legend of supplementary file 3.
Supplementary file 5. S-wave seismic tomography depth-slices (at 40 km, 70 km, and 140 km) based on S-Wave model from SEMUCB-WM1 (French and Romanowicz, 2014), GyPSuM-S (Simmons et al., 2010), and Savani (Auer et al., 2014).
Access Supplementary MaterialReferences
- Acocella V, Morvillo P, Funiciello R. 2005. What controls relay ramps and transfer faults within rift zones? Insights from analogue models. J Struct Geol 27: 397–408. [Google Scholar]
- Agosta F, Ruano P, Rustichelli A, Tondi E, Galindo-Zaldívar J, Sanz de Galdeano C. 2012. Inner structure and deformation mechanisms of normal faults in conglomerates and carbonate grainstones (Granada Basin, Betic Cordillera, Spain): Inferences on fault permeability. J Struct Geol 45: 4–20. [Google Scholar]
- Airy GB. 1855. III. On the computation of the effect of the attraction of mountain-masses, as disturbing the apparent astronomical latitude of stations in geodetic surveys. In: Philosophical transactions of the Royal Society of London, p. 101–104. [Google Scholar]
- Alt-Epping P, Diamond LW, Wanner C, Hammond GE. 2021. Effect of glacial/interglacial recharge conditions on flow of meteoric water through deep orogenic faults: Insights into the geothermal system at Grimsel Pass, Switzerland. Journal of Geophysical Research: Solid Earth 126: e2020JB021271. [Google Scholar]
- Armandine Les Landes A, Guillon T, Peter-Borie M, Blaisonneau A, Rachez X, Gentier S. 2019. Locating geothermal resources: insights from 3D stress and flow models at the upper Rhine Graben scale. Geofluids 2019: 8494539. [Google Scholar]
- Artemieva IM. 2019. Lithosphere structure in Europe from thermal isostasy. Earth-Sci Rev 188: 454–468. [Google Scholar]
- Arthaud F, Matte P. 1975. Les decrochements tardi-hercyniens du sud-ouest de l’europe. Geometrie et essai de reconstitution des conditions de la deformation. Tectonophysics 25. [Google Scholar]
- Aubert I, Lamarche J, Léonide P. 2021. Ternary fault permeability diagram: An innovative way to estimate fault zones hydraulics. J. Struct. Geol 14: 104349. [Google Scholar]
- Auer L, Boschi L, Becker TW, Nissen‐Meyer T, Giardini D. 2014. Savani: A variable resolution whole‐mantle model of anisotropic shear velocity variations based on multiple data sets. J Geophys Res: Solid Earth 119: 3006–3034. [Google Scholar]
- Babuška V, Plomerová J, Vecsey L, Granet M, Achauer U. 2002. Seismic anisotropy of the French Massif Central and predisposition of Cenozoic rifting and volcanism by Variscan suture hidden in the mantle lithosphere. Tectonics 21: 1–11. [Google Scholar]
- Ballèvre M, Bosse V, Ducassou C, Pitra P. 2009. Palaeozoic history of the Armorican Massif: models for the tectonic evolution of the suture zones. CR Géosci 341: 174–201. [Google Scholar]
- Baptiste J. 2016. Cartographie structurale et lithologique du substratum du Bassin parisien et sa place dans la chaîne varisque de l’Europe de l’Ouest: approches combinées géophysiques, pétrophysiques, géochronologiques et modélisations 2D: Université d’Orléans, pp. 367. [Google Scholar]
- Barton CA, Zoback MD. Moos D. 1995. Fluid flow along potentially active faults in crystalline rock. Geology 23: 683–686. [Google Scholar]
- Barruol G, Deschamps A, Coutant O. 2004. Mapping upper mantle anisotropy beneath SE France by SKS splitting indicates Neogene asthenospheric flow induced by Apenninic slab roll-back and deflected by the deep Alpine roots. Tectonophysics 394: 125–138. [CrossRef] [Google Scholar]
- Bell RE, Jackson CA, Whipp PS, Clements B. 2014. Strain migration during multiphase extension: Observations from the northern North Sea. Tectonics 33: 1936–1963. [Google Scholar]
- Bergerat F. 1977. Le rôle des décrochements dans les liaisons tectoniques entre le fossé de la Saône et le fossé Rhénan. 4: 195–199. [Google Scholar]
- Bergerat F, Chorowicz J. 1981. Etude des images Landsat de la zone transformante Rhin-Saône (France). Geologische Rundschau 70: 354–367. [Google Scholar]
- Beucler É, Bonnin M, Hourcade C, van Vliet-Lanoë B, Perrin C, Provost L, et al. 2021. Characteristics and possible origins of the seismicity in northwestern France. CR Géosci 353: 1–25. [Google Scholar]
- Bird P. 1979. Continental delamination and the Colorado Plateau. J Geophys Res: Solid Earth 84: 7561–7571. [Google Scholar]
- Bois C. 1991. Post‐orogenic evolution of the European crust studied from ECORS deep seismic profiles. Continental Lithosphere: Deep Seismic Reflections 22: 59–68. [Google Scholar]
- Bokelmann G, Qorbani E, Bianchi I. 2013. Seismic anisotropy and large-scale deformation of the Eastern Alps. Earth Planet Sci Lett 383: 1–6. [Google Scholar]
- Bonini M, Corti G, Innocenti F, Manetti P, Mazzarini F, Abebe T, et al. 2005. Evolution of the Main Ethiopian Rift in the frame of Afar and Kenya rifts propagation. Tectonics 24. [Google Scholar]
- Bonnin M, Chevrot S, Gaudot I, Haugmard M, Group PW. 2017. Upper-mantle deformation beneath the Pyrenean domain inferred from SKS splitting in northern Spain and southern France. Geophys J Int 210: 898–910. [CrossRef] [Google Scholar]
- Bormann P, Burghardt P-T., Makeyeva LI, Vinnik LP. 1993. Teleseismic shear-wave splitting and deformations in Central Europe. Phys Earth Planet Inter 78: 157–166. [Google Scholar]
- Bourcier WL, Lin M, Nix G. 2005. Recovery of Minerals and Metals from Geothermal Fluids. LLNL UCRL-CONF-215135; Presented at 2003 SME Annual Meeting, Cincinnati OH, United States (2005). [Google Scholar]
- Calcagno P, Baujard C, Guillou-Frottier L, Dagallier A, Genter A. 2014. Estimation of the deep geothermal potential within the Tertiary Limagne basin (French Massif Central): An integrated 3D geological and thermal approach. Geothermics 51: 496–508. [Google Scholar]
- Cammarano F, Deuss A, Goes S, Giardini D. 2005. One‐dimensional physical reference models for the upper mantle and transition zone: Combining seismic and mineral physics constraints. J Geophys Res: Solid Earth 110. [Google Scholar]
- Cara M, Cansi Y, Schlupp A, Arroucau P, Béthoux N, Beucler E, et al. 2015. SI-Hex: a new catalogue of instrumental seismicity for metropolitan France. Bull Soc Géol Fr 186: 3–19. [Google Scholar]
- Carminati E, Wortel MJR, Spakman W, Sabadini R. 1998. The role of slab detachment processes in the opening of the western-central Mediterranean basins: some geological and geophysical evidence. Earth Planet Sci Lett 160: 651–665. [CrossRef] [Google Scholar]
- Chantraine J, Egal E, Thiéblemont D, Le Goff E, Guerrot C, Ballèvre M, et al. 2001. The Cadomian active margin (North Armorican Massif, France): a segment of the north Atlantic Panafrican belt. Tectonophysics 331: 1–18. [CrossRef] [Google Scholar]
- Chantraine J, Autran A, Cavelier C. 2003. Carte géologique de la France (version numérique) à l’échelle du millionième. BRGM, Orléans. [Google Scholar]
- Chardon D, Aretz M, Roques D. 2020. Reappraisal of Variscan tectonics in the southern French Massif Central. Tectonophysics 787: 228477. [CrossRef] [Google Scholar]
- Chen M, Al-Maktoumi A, Rajabi MM, Izady A, Al-Mamari H, Cai J. 2021. Evaluation of CO2 sequestration and circulation in fault-bounded thin geothermal reservoirs in North Oman using response surface methods. J Hydrol 598: 126411. [Google Scholar]
- Choi J-H., Edwards P, Ko K, Kim Y-S. 2016. Definition and classification of fault damage zones: A review and a new methodological approach. Earth-Sci Rev 152: 70–87. [Google Scholar]
- Chorowicz J. 1992. The role of ancient structures in the genesis and evolution of the East African Rift. Bull Soc Géol Fr 163: 217–227. [Google Scholar]
- Civiero C, Custódio S, Rawlinson N, Strak V, Silveira G, Arroucau P, et al. 2019. Thermal nature of mantle upwellings below the Ibero‐Western Maghreb region inferred from teleseismic tomography. J Geophys Res: Solid Earth 124: 1781–1801. [Google Scholar]
- Clauser BE, Subhiyah RG, Nungester RJ, Ripkey DR, Clyman SG, McKinley D. 1995. Scoring a performance-based assessment by modeling the judgments of experts. J. Educ. Meas 32: 397–415. [Google Scholar]
- Clauser C, Huenges E. 1995. Thermal conductivity of rocks and minerals. In: Rock physics and phase relations: a handbook of physical constants. vol. 3, pp. 105–126. [Google Scholar]
- Cloetingh SAPL, Ziegler PA, Bogaard PJF, Andriessen PAM, Artemieva IM, Bada G, et al. 2007. TOPO-EUROPE: The geoscience of coupled deep Earth-surface processes. Glob Planet Change 58: 1–118. [Google Scholar]
- Contini D, Theobald N. 1974. Relations entre le fossé rhenan et le fossé de la Saône. Tectonique des régions sous-vosgiennes et pré-jurassiennes. Approaches to taphrogenesis. Sc Report, Stuttgart: 310–321. [Google Scholar]
- Corti G. 2009. Continental rift evolution: from rift initiation to incipient break-up in the Main Ethiopian Rift, East Africa. Earth-Sci Rev 96: 1–53. [Google Scholar]
- Cox SC, Menzies CD, Sutherland R, Denys PH, Chamberlain C, Teagle, D.A. 2012. Changes in hot spring temperature and hydrogeology of the Alpine Fault hanging wall, New Zealand, induced by distal South Island earthquakes. Crustal Permeability 228–248. [Google Scholar]
- Curewitz D, Karson JA. 1997. Structural settings of hydrothermal outflow: Fracture permeability maintained by fault propagation and interaction. J. Volcanol. Geotherm. Res 79: 149–168. [Google Scholar]
- Daniilidis A, Nick HM, Bruhn DF. 2020. Interdependencies between physical, design and operational parameters for direct use geothermal heat in faulted hydrothermal reservoirs. Geothermics 86: 101806. [Google Scholar]
- Daniilidis A, Saeid S, Doonechaly NG. 2021. The fault plane as the main fluid pathway: Geothermal field development options under subsurface and operational uncertainty. Renew Energy 171: 927–946. [Google Scholar]
- Dezayes C, Lerouge C. 2019. Reconstructing paleofluid circulation at the Hercynian basement/Mesozoic sedimentary cover interface in the Upper Rhine Graben. Geofluids 2019: 1–30. [CrossRef] [Google Scholar]
- Dèzes P, Schmid SM, Ziegler PA. 2004. Evolution of the European Cenozoic Rift System: interaction of the Alpine and Pyrenean orogens with their foreland lithosphere. Tectonophysics 389: 1–33. [CrossRef] [Google Scholar]
- Dupret L, Dissler E, Doré F, Gresselin F, Le Gall J. 1990. Cadomian geodynamic evolution of the northeastern Armorican Massif (Normandy and Maine). Geol Soc London Spec Publ 51: 115–131. [Google Scholar]
- Duringer P, Aichholzer C, Orciani S, Genter A. 2019. The complete lithostratigraphic section of the geothermal wells in Rittershoffen (Upper Rhine Graben, eastern France): a key for future geothermal wells. BSGF-Earth Sci Bull 190: 13. [Google Scholar]
- Durlet C, Jacquin T, Floquet M. 1997. Tectonique synsédimentaire distensive dans les calcaires aaléno-bajociens du Seuil de Bourgogne (France). CR Acad Sci-Ser IIA-Earth Planet Sci 324: 1001–1008. [Google Scholar]
- Duwiquet H, Guillou-Frottier L, Arbaret L, Bellanger M, Guillon T, Heap MJ. 2021. Crustal fault zones (CFZ) as geothermal power systems: A preliminary 3D THM model constrained by a multidisciplinary approach. Geofluids 2021: 8855632. [Google Scholar]
- Duwiquet H. 2022. Crustal Fault Zones as geothermal power systems. Contribution of numerical modelling and comparison with natural systems, PhD Thesis, Université d’Orléans, pp. 401. [Google Scholar]
- Duwiquet H, Arbaret L, Guillou-Frottier L, Heap MJ, Bellanger M. 2019. On the geothermal potential of crustal fault zones: a case study from the Pontgibaud area (French Massif Central, France). Geotherm Energy 7: 33. [Google Scholar]
- Duwiquet H, Guillou-Frottier L, Arbaret L, Guillon T, Bellanger M, Heap M. 2020. Crustal Fault Zone: New geothermal reservoir? Structural dataset and preliminary 3D TH (M) modelling of the Pontgibaud fault zone (French Massif Central). In: 45th workshop on geothermal reservoir engineering. [Google Scholar]
- Duwiquet H, Magri F, Lopez S, Guillon T, Arbaret L, Bellanger M, et al. 2022. Tectonic regime as a control factor for crustal fault zone (CFZ) geothermal reservoir in an amagmatic system: A 3D dynamic numerical modeling approach. Nat Resour Res 31: 3155–3172. [CrossRef] [Google Scholar]
- Edel JB, Schulmann K, Lexa O, Lardeaux JM. 2018. Late Palaeozoic palaeomagnetic and tectonic constraints for amalgamation of Pangea supercontinent in the European Variscan belt. Earth-Sci Rev 177: 589–612. [CrossRef] [Google Scholar]
- Edel, Schulmann K, Rotstein Y. 2007. The Variscan tectonic inheritance of the Upper Rhine Graben: evidence of reactivations in the Lias, Late Eocene-Oligocene up to the recent. Int J Earth Sci 96: 305–325. [Google Scholar]
- El‐Sharkawy A, Meier T, Lebedev S, Behrmann JH, Hamada M, Cristiano L, et al. 2020. The slab puzzle of the Alpine‐Mediterranean region: Insights from a new, high‐resolution, shear wave velocity model of the upper mantle. Geochem Geophys Geosyst 21: e2020GC008993. [Google Scholar]
- Faccenna C, Becker TW. 2010. Shaping mobile belts by small-scale convection. Nature 465: 602–605. [CrossRef] [Google Scholar]
- Faccenna C, Becker TW, Lallemand S, Lagabrielle Y, Funiciello F, Piromallo C. 2010. Subduction-triggered magmatic pulses: A new class of plumes? Earth Planet Sci Lett 299: 54–68. [Google Scholar]
- Faccenna C, Becker TW, Auer L, Billi A, Boschi L, Brun JP, et al. 2014. Mantle dynamics in the Mediterranean. Rev Geophys 52: 283–332. [Google Scholar]
- Faccenna C, Becker TW. 2020. Topographic expressions of mantle dynamics in the Mediterranean. Earth-Sci Rev 209: 103327. [Google Scholar]
- Faulds JE, Varga RJ, Stewart JH. 1998. The role of accommodation zones and transfer zones in the regional segmentation of extended terranes. Spec Papers-Geol Soc Am: 1–46. [Google Scholar]
- Faulds JE, Coolbaugh MF, Vice GS, Edwards ML. 2006. Characterizing structural controls of geothermal fields in the northwestern Great Basin: A progress report. GRC Transactions 30: 69–76. [Google Scholar]
- Faulds JE, Coolbaugh MF, Benoit D, Oppliger G, Perkins M, Moeck I, Drakos P. 2010. Structural controls of geothermal activity in the northern Hot Springs Mountains, western Nevada: The tale of three geothermal systems (Brady’s, Desert Perk, Desert Queen): GRC Transactions 34: 675–683. [Google Scholar]
- Faulds JE, Hinz NH, Kreemer C, Coolbaugh MF. 2012. Regional patterns of geothermal activity in the Great Basin region, western USA: Correlation with strain rates: Trans. Geotherm. Resour. Counc 36: 897–902. [Google Scholar]
- Faulds J, Hinz N. 2015. Favorable tectonic and structural settings of geothermal systems in the Great Basin region, western USA: Proxies for discovering blind geothermal systems. In Proceedings World Geothermal Congress, Melbourne, Australia 19–25 April 2015 (No. DOE-UNR-06731-02). Nevada Bureau of Mines and Geology, University of Nevada, Reno. [Google Scholar]
- Forte AM, Peltier WR, Dziewonski AM, Woodward RL. 1993. Dynamic surface topography: A new interpretation based upon mantle flow models derived from seismic tomography. Geophys Res Lett 20: 225–228. [Google Scholar]
- Franke W, Cocks LRM, Torsvik TH. 2017. The palaeozoic variscan oceans revisited. Gondwana Res 48: 257–284. [CrossRef] [Google Scholar]
- French SW, Romanowicz BA. 2014. Whole-mantle radially anisotropic shear velocity structure from spectral-element waveform tomography. Geophys J Int 199: 1303–1327. [Google Scholar]
- Frey M, Bär K, Stober I, Reinecker J, van der Vaart J, Sass I. 2022. Assessment of deep geothermal research and development in the Upper Rhine Graben. Geotherm Energy 10: 1–67. [Google Scholar]
- Fuchs S, et al. 2023. The Global Heat Flow Database: Update 2023: [Google Scholar]
- Ganguly S, Mohan Kumar MS. 2012. Geothermal reservoirs—A brief review. J Geol Soc India 79: 589–602. [Google Scholar]
- Giamboni M, Ustaszewski K, Schmid SM, Schumacher ME, Wetzel A. 2004. Plio-Pleistocene transpressional reactivation of Paleozoic and Paleogene structures in the Rhine-Bresse transform zone (northern Switzerland and eastern France). Int J Earth Sci 93: 207–223. [Google Scholar]
- Gibbs AD. 1990. Linked fault families in basin formation. J Struct Geol 12: 795–803. [Google Scholar]
- Glaas C, Vidal J, Genter A. 2021. Structural characterization of naturally fractured geothermal reservoirs in the central Upper Rhine Graben. J Struct Geol 148: 104370. [Google Scholar]
- Goes S, Spakman W, Bijwaard H. 1999. A lower mantle source for central European volcanism. Science 286: 1928–1931. [Google Scholar]
- Granet M, Wilson M, Achauer, U. 1995. Imaging a mantle plume beneath the French Massif Central. Earth Planet. Sci. Lett 136: 281–296. [Google Scholar]
- Granet M, Judenherc S, Souriau A. 2000. Des images du systeme lithosphere-asthenosphere sous la France et leurs implications geodynamiques; l’apport de la tomographie telesismique et de l’anisotropie sismique. Bull Soc Géol Fr 171: 149–167. [Google Scholar]
- Gudmundsdottir H, Horne RN. 2020. Prediction modeling for geothermal reservoirs using deep learning. In: 45th workshop on geothermal reservoir engineering. Stanford, California: Stanford University, pp. 1–12. [Google Scholar]
- Gudmundsson A. 2022. Transport of geothermal fluids along dikes and fault zones. Energies 15: 7106. [Google Scholar]
- Guillou-Frottier L, Duwiquet H, Launay G, Taillefer A, Roche V, Link G. 2020. On the morphology and amplitude of 2D and 3D thermal anomalies induced by buoyancy-driven flow within and around fault zones. Solid Earth 11: 1571–1595. [CrossRef] [Google Scholar]
- Guillou-Frottier L, Milesi G, Roche V, Duwiquet H, Taillefer A. 2024. Heat flow, thermal anomalies, tectonic regimes and high-temperature geothermal systems in fault zones. CR Géosci 356: 1–33. [Google Scholar]
- Hager BH, Richards MA. 1989. Long-wavelength variations in Earth’s geoid: physical models and dynamical implications. Philos Trans Royal Soc London. Ser A, Math Phys Sci 328: 309–327. [Google Scholar]
- Heidbach O, Rajabi M, Cui X, Fuchs K, Müller B, Reinecker J, et al. 2018. The World Stress Map database release 2016: Crustal stress pattern across scales. Tectonophysics 744: 484–498. [CrossRef] [Google Scholar]
- Henry Pratt VJ. 1855. On the Attraction of the Himalaya Mountains and of the elevated Regions beyond them, upon the Plumb-line in India. Monthly Notices Royal Astron Soc 16: 36–41. [Google Scholar]
- Henstra GA, Kristensen TB, Rotevatn A, Gawthorpe RL. 2019. How do pre‐existing normal faults influence rift geometry? A comparison of adjacent basins with contrasting underlying structure on the Lofoten Margin, Norway. Basin Res 31: 1083–1097. [Google Scholar]
- Herquel G, Tapponnier P, Wittlinger G, Mei J, Danian S. 1999. Teleseismic shear wave splitting and lithospheric anisotropy beneath and across the Altyn Tagh fault. Geophys Res Lett 26: 3225–3228. [Google Scholar]
- Hodge M, Fagereng Å, Biggs J, Mdala H. 2018. Controls on early‐rift geometry: New perspectives from the Bilila‐Mtakataka Fault, Malawi. Geophys Res Lett 45: 3896–3905. [Google Scholar]
- Hoggard M, Austermann J, Randel C, Stephenson S. 2021. Observational estimates of dynamic topography through space and time. Mantle Convection Surface Expressions: 371–411. [Google Scholar]
- Hosseini K. 2016. Global multiple-frequency seismic tomography using teleseismic and core-diffracted body waves, PhD Thesis. LMU München: Faculty of Geosciences, pp. 171. [Google Scholar]
- Hosseini K, Matthews KJ, Sigloch K, Shephard GE, Domeier M, Tsekhmistrenko M. 2018. SubMachine: Web‐based tools for exploring seismic tomography and other models of Earth’s deep interior. Geochem Geophys Geosyst 19: 1464–1483. [Google Scholar]
- Illies JH. 1972. The Rhine graben rift system-plate tectonics and transform faulting. Geophys Surveys 1: 27–60. [Google Scholar]
- Ingebritsen S, Gleeson, T. 2017. Crustal permeability. Hydrogeology Journal 25: 2221–2224. [Google Scholar]
- Italiano F, Martelli M, Martinelli G, Nuccio PM. 2000. Geochemical evidence of melt intrusions along lithospheric faults of the Southern Apennines, Italy: geodynamic and seismogenic implications. J Geophys Res: Solid Earth 105: 13569–13578. [Google Scholar]
- Jacquin T, de Graciansky P-C. 1998. Major transgressive/regressive cycles: the stratigraphic signature of European basin development. In: Mesozoic and Cenozoic sequence stratigraphy of European Basins. SEPM Special Publication, vol. 60, pp. 15-29. [Google Scholar]
- Jauffret D, Coueffe R, Tourliere B. 2008. Etude des ressources en eau profonde du fossé de la Saône en Bourgogne et en Franche-Comté. Rapport BRGM RP-56538-FR, 199 pp. [Google Scholar]
- Jolie E, Scott S, Faulds J, Chambefort I, Axelsson G, Gutiérrez-Negrín LC, et al. 2021. Geological controls on geothermal resources for power generation. Nat Rev Earth Environ 2: 324–339. [Google Scholar]
- Jolivet L, Faccenna C, Piromallo C. 2009. From mantle to crust: Stretching the Mediterranean. Earth Planet Sci Lett 285: 198–209. [CrossRef] [Google Scholar]
- Jolivet L, Romagny A, Gorini C, Maillard A, Thinon I, Couëffé R, et al. 2020. Fast dismantling of a mountain belt by mantle flow: Late-orogenic evolution of Pyrenees and Liguro-Provençal rifting. Tectonophysics 776. [Google Scholar]
- Jolivet L, Menant A, Roche V, Le Pourhiet L, Maillard A, Augier R, et al. 2021. Transfer zones in Mediterranean back-arc regions and tear faults. Bull Soc Géol Fr 192. [Google Scholar]
- Jolivet L, Allanic C, Becker T, Bellahsen N, Briais J, Davaille A, et al. 2022. Continental rifts and mantle convection: Insights from the East African Rift and a new model of the West European Rift System, in EGU General Assembly Conference Abstracts: EGU22–1696. [Google Scholar]
- Jolivet L, Faccenna C, Becker T, Davaille A, Lasseur E, Briais J, et al. 2025. Continental rifts and mantle convection. Earth-Sci Rev 270: 105243 [Google Scholar]
- Joly A, Chen Y, Faure M, Martelet G. 2007. A multidisciplinary study of a syntectonic pluton close to a major lithospheric‐scale fault—Relationships between the Montmarault granitic massif and the Sillon Houiller Fault in the Variscan French Massif Central: 1. Geochronology, mineral fabrics, and tectonic implications. J Geophys Res: Solid Earth 112: B10104. [Google Scholar]
- Joly A, Martelet G, Chen Y, Faure M. 2008. A multidisciplinary study of a syntectonic pluton close to a major lithospheric‐scale fault—Relationships between the Montmarault granitic massif and the Sillon Houiller Fault in the Variscan French Massif Central: 2. Gravity, aeromagnetic investigations, and 3‐D geologic modeling. J Geophys Res: Solid Earth 113: B01404. [Google Scholar]
- Jomard H, Cushing EM, Palumbo L, Baize S, David C, Chartier T. 2017. Transposing an active fault database into a seismic hazard fault model for nuclear facilities-Part 1: Building a database of potentially active faults (BDFA) for metropolitan France. Nat Hazards Earth Syst Sci 17: 1573–1584. [CrossRef] [Google Scholar]
- Jordan TH. 1978. Composition and development of the continental tectosphere. Nature 274: 544–548. [CrossRef] [Google Scholar]
- Judenherc S, Granet M, Brun J-P., Poupinet G. 2003. The Hercynian collision in the Armorican Massif: evidence of different lithospheric domains inferred from seismic tomography and anisotropy. Bull Soc Géol Fr 174: 45–57. [Google Scholar]
- Kroner U, Mansy J-L., Mazur S, Aleksandrowski P, Hann HP, Huckriede H, et al. 2008. Variscan tectonics. Geol Central Europe 599–664. [Google Scholar]
- Kroner U, Romer RL. 2013. Two plates — Many subduction zones: The Variscan orogeny reconsidered. Gondwana Res 24: 298–329. [CrossRef] [Google Scholar]
- Kukkonen IT, Peltoniemi S. 1998. Relationships between thermal and other petrophysical properties of rocks in Finland. Phys Chem Earth 23: 341–349. [Google Scholar]
- Lacombe O, Angelier J, Byrne D, Dupin JM. 1993. Eocene‐Oligocene tectonics and kinematics of the Rhine‐Saone continental transform zone (eastern France). Tectonics 12: 874–888. [Google Scholar]
- Laubach SE, Eichhubl P, Hilgers C, Lander RH. 2010. Structural diagenesis. J Struct Geol 32: 1866–1872. https://doi.org/10.1016/j.jsg.2010.10.001. [Google Scholar]
- Lavayssière A, Drooff C, Ebinger C, Gallacher R, Illsley‐Kemp F, Oliva SJ, et al. 2019. Depth extent and kinematics of faulting in the southern Tanganyika rift, Africa. Tectonics 38: 842–862. [Google Scholar]
- Lekić V, Romanowicz B. 2011. Inferring upper-mantle structure by full waveform tomography with the spectral element method. Geophys J Int 185: 799–831. [Google Scholar]
- Leloup PH, Lacassin R, Tapponnier P, Schärer U, Zhong D, Liu X, et al. 1995. The Ailao Shan-Red river shear zone (Yunnan, China), tertiary transform boundary of Indochina. Tectonophysics 251: 3–84. [Google Scholar]
- Lemoine M. 1985. Structuration jurassique des Alpes occidentales et palinspastique de la Téthys ligure. Bull Soc Géol Fr 1: 127–137. [Google Scholar]
- Linnemann U, Pereira F, Jeffries TE, Drost K, Gerdes A. 2008. The Cadomian Orogeny and the opening of the Rheic Ocean: the diacrony of geotectonic processes constrained by LA-ICP-MS U-Pb zircon dating (Ossa-Morena and Saxo-Thuringian Zones, Iberian and Bohemian Massifs). Tectonophysics 461: 21–43. [CrossRef] [Google Scholar]
- Linnemann U, Gerdes A, Hofmann M, Marko L. 2014. The Cadomian Orogen: Neoproterozoic to Early Cambrian crustal growth and orogenic zoning along the periphery of the West African Craton—Constraints from U-Pb zircon ages and Hf isotopes (Schwarzburg Antiform, Germany). Precambrian Res 244: 236–278. [CrossRef] [Google Scholar]
- Liu J, Yang H, Xu K, Wang Z, Liu X, Cui L, et al. 2022. Genetic mechanism of transfer zones in rift basins: Insights from geomechanical models. GSA Bull 134: 2436–2452. [Google Scholar]
- Louis S, Luijendijk E, Dunkl I, Person M. 2019. Episodic fluid flow in an active fault. Geology 47: 938–942. [Google Scholar]
- Lucazeau F, Vasseur G, Bayer R. 1984. Interpretation of heat flow data in the French Massif Central. Tectonophysics 103: 99–119. [Google Scholar]
- Lucazeau F, Vasseur G. 1989. Heat flow density data from France and surrounding margins. Tectonophysics 164: 251–258. [Google Scholar]
- Lucazeau F. 2019. Analysis and mapping of an updated terrestrial heat flow data set. Geochem Geophys Geosyst 20: 4001–4024. [Google Scholar]
- Madritsch H. 2008. Structural evolution and neotectonics of the Rhine-Bresse Transfer Zone, PhD Thesis, University_of_Basel, pp. 178. [Google Scholar]
- Madritsch H, Kounov A, Schmid SM, Fabbri O. 2009. Multiple fault reactivations within the intra-continental Rhine-Bresse transfer zone (La Serre horst, eastern France). Tectonophysics 471: 297–318. [Google Scholar]
- Manchuel K, Traversa P, Baumont D, Cara M, Nayman E, Durouchoux C. 2018. The french seismic catalogue (fcat-17). Bull Earthq Eng 16: 2227–2251. [Google Scholar]
- Marinković G, Papić P, Spahić D, Andrijašević J, Spahić MP. 2023. Case study of mountainous geothermal reservoirs (Kopaonik Mt., southwestern Serbia): Fault-controlled fluid compartmentalization within a late Paleogene-Neogene core-complex. Geothermics 114: 102799. [Google Scholar]
- Matte P. 2001. The Variscan collage and orogeny (480–290 Ma) and the tectonic definition of the Armorica microplate: a review. Terra Nova 13: 122–128. [CrossRef] [Google Scholar]
- Mazur S, Palomeras I, Schiffer C, Vanderhaeghe O, Puziewicz J. 2026. Lithospheric structure and tectonic memory of the European Variscan belt. Geol Soc London Spec Publ 557: gslspecpub2025–7. [Google Scholar]
- Mazzotti S, Jomard H, Masson F. 2020. Processes and deformation rates generating seismicity in metropolitan France and conterminous Western Europe. Bull Soc Géol Fr 191: 1–20. [Google Scholar]
- Mazzotti S, Aubagnac C, Bollinger L, Oscanoa KC, Delouis B, Do Paco D, et al. 2021. FMHex20: An earthquake focal mechanism database for seismotectonic analyses in metropolitan France and bordering regions. Bull Soc Géol Fr 192: 10. [Google Scholar]
- McLellan JG, Oliver NHS, Schaubs PM. 2004. Fluid flow in extensional environments; numerical modelling with an application to Hamersley iron ores. J. Struct. Geol 26: 1157–1171. [Google Scholar]
- McCann T, Pascal C, Timmerman MJ, Krzywiec P, López-Gómez J, Wetzel L, et al. 2006. Post-Variscan (end Carboniferous-Early Permian) basin evolution in western and central Europe. Geol Soc London Memoirs 32: 355–388. [Google Scholar]
- McKenzie D. 1978. Some remarks on the development of sedimentary basins. Earth Planet Sci Lett 40: 25–32. [Google Scholar]
- McLeod AE, Dawers NH, Underhill JR. 2000. The propagation and linkage of normal faults: insights from the Strathspey-Brent-Statfjord fault array, northern North Sea. Basin Res 12: 263–284. [Google Scholar]
- Medvedev SW, Sponheuer W, Karnik V. 1965. Seismic intensity scale version MSK 1964. In Proceedings of the First Meeting, Working Group on Seismicity and Seismo-Tectonics, Tbilissi, Georgia, 8–12 June. [Google Scholar]
- Merle O, Michon L. 2001. The formation of the West European Rift; a new model as exemplified by the Massif Central area. Bull Soc Géol Fr 172: 213–221. [CrossRef] [Google Scholar]
- Meyer R, Foulger GR. 2007. The European Cenozoic Volcanic Province is not caused by mantle plumes, www.mantleplumes.org pp. 17. [Google Scholar]
- Michon L, Van Balen RT, Merle O, Pagnier H. 2003. The Cenozoic evolution of the Roer Valley Rift System integrated at a European scale. Tectonophysics 367: 101–126. [Google Scholar]
- Moody JD, Hill MJ. 1956. Wrench-fault tectonics. Geol Soc Am Bull 67: 1207–1246. [Google Scholar]
- Mouthereau F, Angrand P, Jourdon A, Ternois S, Fillon C, Calassou S, et al. 2021. Cenozoic mountain building and topographic evolution in Western Europe: impact of billions of years of lithosphere evolution and plate kinematics. BSGF-Earth Sci Bull 192: 56. [CrossRef] [EDP Sciences] [Google Scholar]
- Muirhead JD, Kattenhorn SA. 2018. Activation of preexisting transverse structures in an evolving magmatic rift in East Africa. J Struct Geol 106: 1–18. [Google Scholar]
- Muirhead JD, Wright LJM, Scholz CA. 2019. Rift evolution in regions of low magma input in East Africa. Earth Planet Sci Lett 506: 332–346. [Google Scholar]
- Neuharth D, Brune S, Wrona T, Glerum A, Braun J, Yuan X. 2022. Evolution of rift systems and their fault networks in response to surface processes. Tectonics 41: e2021TC007166. [CrossRef] [Google Scholar]
- Ojo OO, Ohenhen LO, Kolawole F, Johnson SG, Chindandali PR, Atekwana EA, et al. 2022. Under-displaced normal faults: Strain accommodation along an early-stage rift-bounding fault in the Southern Malawi Rift. Front Earth Sci 10: 1–19. [PubMed] [Google Scholar]
- Pasyanos ME, Masters TG, Laske G, Ma Z. 2014. LITHO1. 0: An updated crust and lithospheric model of the Earth. J Geophys Res: Solid Earth 119: 2153–2173. [Google Scholar]
- Peacock DCP, Knipe RJ, Sanderson DJ. 2000. Glossary of normal faults. J Struct Geol 22: 291–305. [Google Scholar]
- Pederson, C., Mueller, M., Lippert, K., Igbokwe, O.A., Riechelmann, S., Lersch, S., Benger, P., Verdecchia, A., and Immenhauser, A. 2021. Impact of a regional fault zone on the properties of a deep geothermal carbonate reservoir unit (Devonian of NRW). Zeitschrifts der Deutschen Gesellschaft für Geowissenschaften-Journal of Applied and Regional Geology. [Google Scholar]
- Pili E, Ricard Y, Lardeaux J-M., Sheppard SMF. 1997. Lithospheric shear zones and mantle-crust connections. Tectonophysics 280: 15–29. [Google Scholar]
- Piromallo C, Vincent AP, Yuen DA, Morelli A. 2001. Dynamics of the transition zone under Europe inferred from wavelet cross-spectra of seismic tomography. Phys Earth Planet Inter 125: 125–139. [Google Scholar]
- Piromallo C, Faccenna C. 2004. How deep can we find the traces of Alpine subduction? Geophys Res Lett 31. [Google Scholar]
- Piromallo C, Gasperini D, Macera P, Faccenna C. 2008. A late Cretaceous contamination episode of the European-Mediterranean mantle. Earth Planet Sci Lett 268: 15–27. [Google Scholar]
- Platt JP, Behr WM. 2011. Deep structure of lithospheric fault zones. Geophys Res Lett 38: 537–550. [Google Scholar]
- Prodehl C, Glahn A, Gutscher M, Haak V. 1992. Lithospheric cross sections of the European Cenozoic rift system. Tectonophysics 208: 113–138. [Google Scholar]
- Prodehl C, Haak V. 2006. The European cenozoic rift system. In: Developments in geotectonics. Elsevier vol. 25, pp. 133–212. [Google Scholar]
- Quesne D, Guiraud M, Garcia J-P., Thierry J, Lathuilière B, Audebert N. 2000. Marqueurs d’une structuration extensive jurassique en arrière de la marge nord-téthysienne (monts du Mâconnais, Bourgogne, France). CR Acad Sci-Ser IIA-Earth Planet Sci 330: 623–629. [Google Scholar]
- Rappisi F, VanderBeek BP, Faccenda M, Morelli A, Molinari I. 2022. Slab geometry and upper mantle flow patterns in the Central Mediterranean from 3D anisotropic P‐wave tomography. J Geophys Res: Solid Earth 127: e2021JB023488. [Google Scholar]
- Regenspurg S, Feldbusch E, Byrne J, Deon F, Driba DL, Henninges J, Klapper, A, Naumann, R, Reinsch, T, Schubert C. 2015. Mineral precipitation during production of geothermal fluid from a Permian Rotliegend reservoir. Geothermics 54: 122–135. [Google Scholar]
- Ricard Y, Richards M, Lithgow‐Bertelloni C, Le Stunff Y. 1993. A geodynamic model of mantle density heterogeneity. J Geophys Res: Solid Earth 98: 21895–21909. [Google Scholar]
- Ring U. 1994. The influence of preexisting structure on the evolution of the Cenozoic Malawi rift (East African rift system). Tectonics 13: 313–326. [Google Scholar]
- Ritter JRR, Jordan M, Christensen UR, Achauer U. 2001. A mantle plume below the Eifel volcanic fields, Germany. Earth Planet Sci Lett 186: 7–14. [Google Scholar]
- Ritz J-F., Baize S, Audin L, Authémayou C, Graveleau F, Kaub C, et al. 2021. New perspectives in studying active faults in metropolitan France: the “Active faults France”(FACT/ATS) research axis from the Resif-Epos consortium. CR Géosci 353: 381–412. [Google Scholar]
- Rocher M, Chevalier F, Petit C, Guiraud M. 2003. Tectonics of the Northern Bresse region (France) during the Alpine cycle. Geodin Acta 16: 131–147. [Google Scholar]
- Romagny A, Jolivet L, Menant A, Bessière E, Maillard A, Canva A, et al. 2020. Detailed tectonic reconstructions of the Western Mediterranean region for the last 35 Ma, insights on driving mechanisms. Bull Soc Géol Fr 191. [Google Scholar]
- Rowland JV, Sibson RH. 2004. Structural controls on hydrothermal flow in a segmented rift system, Taupo Volcanic Zone, New Zealand. Geofluids 4: 259–283. [CrossRef] [Google Scholar]
- Sandwell DT, Müller RD, Smith WHF, Garcia E, Francis R. 2014. New global marine gravity model from CryoSat-2 and Jason-1 reveals buried tectonic structure. Science 346: 65–67. [Google Scholar]
- Schäfer F, Oncken O, Kemnitz H, Romer RL. 2000. Upper-plate deformation during collisional orogeny: a case study from the German Variscides (Saxo-Thuringian Zone). Geol Soc London Spec Publ 179: 281–302. [Google Scholar]
- Schmandt B, Humphreys E. 2010. Complex subduction and small-scale convection revealed by body-wave tomography of the western United States upper mantle. Earth Planet Sci Lett 297: 435–445. [Google Scholar]
- Schumacher ME. 2002. Upper Rhine Graben: role of preexisting structures during rift evolution. Tectonics 21: 1–6. [Google Scholar]
- Séranne M, Couëffé R, Husson E, Baral C, Villard J. 2021. The transition from Pyrenean shortening to Gulf of Lion rifting in Languedoc (South France)-A tectonic-sedimentation analysis. Bull Soc Géol Fr 192: 27. [Google Scholar]
- Sieminski A, Paulssen H, Trampert J, Tromp J. 2008. Finite-frequency SKS splitting: measurement and sensitivity kernels. Bull Seismol Soc Am 98: 1797–1810. [Google Scholar]
- Siler DL, Hinz NH, Faulds JE. 2018. Stress concentrations at structural discontinuities in active fault zones in the western United States: Implications for permeability and fluid flow in geothermal fields. Bulletin 130: 1273–1288. [Google Scholar]
- Simmons NA, Forte AM, Boschi L, Grand SP. 2010. GyPSuM: A joint tomographic model of mantle density and seismic wave speeds. J Geophys Res: Solid Earth 115: 109–124. [Google Scholar]
- Sissingh W. 1998. Comparative tertiary stratigraphy of the Rhine Graben, Bresse Graben and Molasse Basin: correlation of Alpine foreland events. Tectonophysics 300: 249–284. [Google Scholar]
- Sissingh W. 2001. Tectonostratigraphy of the West Alpine Foreland: correlation of Tertiary sedimentary sequences, changes in eustatic sea-level and stress regimes. Tectonophysics 333: 361–400. [CrossRef] [Google Scholar]
- Smith M, Mosley P. 1993. Crustal heterogeneity and basement influence on the development of the Kenya Rift, East Africa. Tectonics 12: 591–606. [Google Scholar]
- Sobolev SV, Zeyen H, Stoll G, Werling F, Altherr R, Fuchs K. 1996. Upper mantle temperatures from teleseismic tomography of French Massif Central including effects of composition, mineral reactions, anharmonicity, anelasticity and partial melt. Earth Planet Sci Lett 139: 147–163. [Google Scholar]
- Stephenson SN, Hoggard MJ, Holdt MC, White N. 2024. Continental residual topography extracted from global analysis of crustal structure. J Geophys Res: Solid Earth 129: e2023JB026735. [Google Scholar]
- Taillefer A, Soliva R, Guillou-Frottier L, Le Goff E, Martin G, Seranne M. 2017. Fault-Related Controls on Upward Hydrothermal Flow: An Integrated Geological Study of the Têt Fault System, Eastern Pyrénées (France). Geofluids 2017: 8190109. [Google Scholar]
- Taillefer A, Guillou-Frottier L, Soliva R, Magri F, Lopez S, Courrioux G, Millot R, Ladouche B, Le Goff E. 2018. Topographic and faults control of hydrothermal circulation along dormant faults in an orogen. Geochemistry, Geophysics, Geosystems 19: 4972–4995. [Google Scholar]
- Taillefer A, Milesi G, Soliva R, Monnier L, Delorme P, Guillou-Frottier G, Le Goff E. 2021. Polyphased brittle deformation around a crustal fault: A multi-scale approach based on remote sensing and field data on the mountains surrounding the Têt hydrothermal system (eastern Pyrénées, France). Tectonophysics 804: 228710. https://doi.org/10.1016/j.tecto.2020.228710 [CrossRef] [Google Scholar]
- Tenzer R, Chen W. 2019. Mantle and sub-lithosphere mantle gravity maps from the LITHO1. 0 global lithospheric model. Earth-Sci Rev 194: 38–56. [Google Scholar]
- Teyssier C, Tikoff B. 1998. Strike-slip partitioned transpression of the San Andreas fault system: a lithospheric-scale approach. Geol Soc London Spec Publ 135: 143–158. [Google Scholar]
- Titus SJ, Medaris Jr LG, Wang HF, Tikoff B. 2007. Continuation of the San Andreas fault system into the upper mantle: Evidence from spinel peridotite xenoliths in the Coyote Lake basalt, central California. Tectonophysics 429: 1–20. [Google Scholar]
- Tommasi A, Vauchez A. 2015. Heterogeneity and anisotropy in the lithospheric mantle. Tectonophysics 661: 11–37. [Google Scholar]
- Ustaszewski K, Schumacher ME, Schmid SM, Nieuwland D. 2005. Fault reactivation in brittle-viscous wrench systems-dynamically scaled analogue models and application to the Rhine-Bresse transfer zone. Quat Sci Rev 24: 363–380. [Google Scholar]
- Vauchez A, Tommasi A. 2003. Wrench faults down to the asthenosphere: geological and geophysical evidence and thermomechanical effects. Geol Soc London Spec Publ 210: 15–34. [Google Scholar]
- Vauchez A, Tommasi A, Mainprice D. 2012. Faults (shear zones) in the Earth’s mantle. Tectonophysics 558: 1–27. [Google Scholar]
- Vinnik LP, Krishna VG, Kind R, Bormann P, Stammler K. 1994. Shear wave splitting in the records of the German Regional Seismic Network. Geophys Res Lett 21: 457–460. [Google Scholar]
- Walker KT, Bokelmann GHR, Klemperer SL, Bock G. 2005. Shear-wave splitting around the Eifel hotspot: evidence for a mantle upwelling. Geophys J Int 163: 962–980. [Google Scholar]
- Walther M, Plenefisch T, Rümpker G. 2014. Automated analysis of SKS splitting to infer upper mantle anisotropy beneath Germany using more than 20 yr of GRSN and GRF data. Geophys J Int 196: 1207–1236. [Google Scholar]
- Wanner C, Diamond LW, Alt-Epping P. 2019. Quantification of 3-D thermal anomalies from surface observations of an orogenic geothermal system (Grimsel Pass, Swiss Alps). Journal of Geophysical Research: Solid Earth, 124: 10839–10854. [Google Scholar]
- Watterson J, Walsh JJ, Gillespie PA, Easton S. 1996. Scaling systematics of fault sizes on a large-scale range fault map. J Struct Geol 18: 199–214. [Google Scholar]
- Wattinne A. 2004. Evolution d’un environnement carbonate lacustre a bioconstructions, en Limagne bourbonnaise (Oligo-Miocène, massif central, France): Museum National d’histoire naturelle, pp. 280. [Google Scholar]
- Wüstefeld A, Bokelmann G, Barruol G, Montagner J-P. 2009. Identifying global seismic anisotropy patterns by correlating shear-wave splitting and surface-wave data. Phys Earth Planet Inter 176: 198–212. [Google Scholar]
- Zaal C, Daniilidis A, Vossepoel FC. 2021. Economic and fault stability analysis of geothermal field development in direct-use hydrothermal reservoirs. Geothermal Energy 9: 12. [Google Scholar]
- Ziegler PA. 1992. European Cenozoic rift system. Tectonophysics 208: 91–111. [CrossRef] [Google Scholar]
- Ziegler PA. 1994. Cenozoic rift system of Western and Central-Europe-an overview. Geol Mijnbouw 73: 99–127. [Google Scholar]
- Ziegler PA, Schumacher ME, Dèzes P, Van Wees J-D., Cloetingh S. 2004. Post-Variscan evolution of the lithosphere in the Rhine Graben area: constraints from subsidence modelling. Geol Soc London Spec Publ 223: 289–317. [Google Scholar]
- Ziegler PA, Dèzes P. 2005. Evolution of the lithosphere in the area of the Rhine Rift System. Int J Earth Sci 94: 594–614. [Google Scholar]
- Ziegler PA, Schumacher ME, Dèzes P, Van Wees J-D., Cloetingh S. 2006. Post-Variscan evolution of the lithosphere in the area of the European Cenozoic Rift System. Geol Soc London Memoirs 32: 97–112. [Google Scholar]
- Zwaan F, Schreurs G. 2017. How oblique extension and structural inheritance influence rift segment interaction: Insights from 4D analog models. Interpretation 5: SD119–SD138. [Google Scholar]
Cite this article as: Aubert I, Vennin E, Kaci T, Pellenard P, Morales C, Collin P-Y, Guiraud M. 2026. Control of lithospheric to crustal fault architecture on Cenozoic Rift geothermal systems (Upper Rhine, Bresse and Limagne, France), BSGF - Earth Sciences Bulletin 197: 7. https://doi.org/10.1051/bsgf/2025024
All Figures
|
Fig. 1 A: Geological map of studied area (modified from the Europe − GISEurope − 1:1,500,000 scale − Bedrock Age; BRGM). The ante Triassic lithospheric discontinuities (dashed grey lines) are modified from Baptiste (2016). URG: Upper Rhine Graben, BG: Bresse Graben, LG: Limagne Graben, LRG : Lower Rhine (Roer Valley) Graben, PB: Paris Basin, PBMA : Paris Basin Magnetic Anomaly, AF: Ales Fault, AiF: Aigueperse Fault, ArF: Argentat Fault, AvF: Avallon Fault, BFF: Black Forest Fault, BF: Bray fault, CF: Cevennes Fault, CHF: Chantonnay Fault, CHoF: Cholet fault, DF: Durance Fault, DTF : Digne Thrust Front, JTF: Jura Thrust Front, LF: Loire Fault, LiF : Limagne Fault, LLF: Lalaye-Lubine fault, LRFS: Lower Rhine Fault System, LMF: La Marche Fault, LSF: La Serre Fault, MF: Marsanne Fault, MFZ: Midi Fault Zone, MzF : Metz fault, NASZ: North Armorican Shear Zone, NPF: North Pyrenees Fault, NSE : Nort-Sur-Edre fault, PBMA: Paris Basin Magnetic Anomaly, PF: Pilat Fault, PFT : Pennic Thrust Front, RBTZ: Rhine Bresse Transfer Zone, RF: Rhine Fault, SANSZ: South Armorican Northern Shear Zone, SASSZ: South Armorican Southern Shear Zone, SBTF : Subalpine Thrust Front, SeF: Seine Fault, SF: Sarre Fault, TF : Tonnerre fault, ValF: Valence Fault, VF: Vittel fault, SHF: Sillon Houiller, WRF: West Rhenan Fault. |
| In the text | |
|
Fig. 2 Different methods and database used with their corresponding earth layers. Illustration of a large-scale lithospheric shear zone is modified from Vauchez and Tommasi (2003). |
| In the text | |
|
Fig. 3 Interpolated maps of surface heat flow data. A: modified from Lucazeau and Vasseur (1989), and B: interpolated from The Global Heat Flow Database: Update 2023. For more details on heat flow data extrapolation, see Annexe 1. The white dashed lines correspond to the heat zone contours, thick and thin dashed line correspond respectively to large-scale and small-scale heat flow anomaly. LFHZ : Low Frequency Heat zone, SHHZ: Sillon Houiller Heat Zone, BHZ: Burgundy Heat Zone, URHZ: Upper Rhine Heat Zone. |
| In the text | |
|
Fig. 4 P-wave seismic tomography images centred on Upper Rhine, Bresse and Limagne Grabens (lat. 40°N to 52°N and ln. 5°W to 11.5°E, based on P-Wave model (Hosseini, 2016; Hosseini et al., 2018), A: Tomography depth-slices at depths of 20 km, 70 km and 140 km, B: Simplified map of tomography warm and cold spots. The high surface heat flow patches of Figure 3B are also reported. The lines identified with the numbers (i.e., 1, 2 and 3) represent the profiles of the sections showed in C. C: 2-D tomography cross-sections at latitude of 48, longitude of 5, and 2 diagonals passing through ECRIS rifts (cross-sections 1 and 3). The depths of the dashed lines are 410, 660, 1000 km from the surface. NAPBD: North Armorica Paris Basin Domain, RBLTZ: Rhine-Bresse-Limagne Transfer zone, NED: North ECRIS domain, SED: South ECRIS Domain. |
| In the text | |
|
Fig. 5 S-wave seismic tomography depth-slices at depths of 140 km based on four different S-Wave models: A: SEMUCB-WM1 (French and Romanowicz, 2014), B: GyPSuM-S (Simmons et al., 2010), C: SEMUlm (Lekić and Romanowicz, 2011), and D: Savani (Auer et al., 2014). |
| In the text | |
|
Fig. 6 Lithosphere- asthenosphere properties of the studied area. A: Tomography depth-slice at depth of 140 km (based on P-Wave model, Hosseini et al., 2018), NAPBD. North Armorica Paris Basin Domain, RBLTZ. Rhine-Bresse-Limagne Transfer zone, NED. North ECRIS domain, SED. South ECRIS Domain. B: Depth of the LAB Lithosphere-Asthenosphere Boundary (i.e., seismic lithosphere thickness) modified from the global model LITHO1.0 (Pasyanos et al., 2014). The high surface heat flow areas are defined from Figure 3B, NAPBD: North Armorica Paris Basin Domain, RBLTZ: Rhine-Bresse-Limagne Transfer zone, NED: North ECRIS domain, SED: South ECRIS Domain |
| In the text | |
|
Fig. 7 A: Gravimetry anomalies after the N80W60 and N80E0 gravimetry maps of Sandwell et al. (2014). B: Depth (km) of the Mohorovicic discontinuity modified after Cloetingh et al. (2007). The high surface heat flow areas are defined from Figure 3B. LDCR: Low-Depth Crustal Region, URG: Upper Rhine Graben, BG: Bresse Graben, LG: Limagne Grabens, LRG: Lower Rhine (Roer Valley) Graben, NAPBD. North Armorica Paris Basin Domain, RBLTZ. Rhine-Bresse-Limagne Transfer zone, NED. North ECRIS domain, SED. South ECRIS Domain. B: Depth of the LAB AvF: Avallon Fault, BF: Bray fault, CHF: Chantonnay Fault, CHoF: Cholet fault, MzF: Metz fault, NASZ: North Armorican Shear Zone, NSE: Nort-Sur-Edre fault, SANSZ: South Armorican Northern Shear Zone, SeF: Seine Fault, SF: Sarre Fault, TF: Tonnerre fault, VF: Vittel fault, NAPBD. North Armorica Paris Basin Domain, RBLTZ. Rhine-Bresse-Limagne Transfer zone, NED. North ECRIS domain, SED. South ECRIS Domain. |
| In the text | |
|
Fig. 8 Compilation of SKS splitting data. Red: measurements from Barruol et al. (2004), dark blue: measurements from Bokelmann et al. (2013), purple: measurements from Bonnin et al. (2017), pink: measurements from Bormann et al. (1993), brown: measurements from Judenherc et al. (2003), green: measurements from Vinnik et al. (1994), light blue: measurements from (Walker et al. (2005), orange: measurements from Walther et al. (2014). SKS splitting data have good lateral but poor vertical resolution and constrain the upper mantle anisotropy (Wüstefeld et al., 2009; Vauchez et al., 2012; Tommasi and Vauchez, 2015). The high surface heat flow areas are defined from Figure 3B. |
| In the text | |
|
Fig. 9 Components of sub-crustal topographical support and surface heat flow on a Brittany-Southern Subalpine Chaîne section (location in Figs. 1, 3, 4AB, 6, 7 and 11A). A) topographic data from source etopo 1: http://www.ndgc.noaa.gov/mgg/fl (from Faccenna and Becker (2020), and Stephenson et al. (2024) and B) dynamic topography (From Faccenna and Becker, 2020), C) Gravity anomaly data from Sandwell et al. (2014), D) surface heat flow data (modified from Lucazeau and Vasseur (1989) and interpolated from The Global Heat Flow Database: Update 2023). Note the superposition of the Rhine-Bresse-Limagne transfer zone (RBLTZ) and the small-scale heat flow anomaly suggesting that RBLTZ is a lithospheric fault zone connecting surface and mantle, E) lithopheric thickness modified from (Pasyanos et al., 2014). The RBLTZ-Massif Central domain is limited to west by the thick-lithosphere of Armorican and it corresponds to a corridor of thin lithosphere associated with upper mantle upwelling and probably edge driven convection, F) P-wave seismic tomography section. The depths of the dashed lines are 410 and 660 km from the surface. |
| In the text | |
|
Fig. 10 Characterization of the upper mantle flows. A: Synthetic map considering the Moho depth, the LAB depth, the tomography anomalies, the high surface temperature, the SKS splitting data and the location of lithospheric and transfer faults. B: Schematic illustration of Oligocene to present mantle flow (modified from Jolivet et al., 2022). C: Mantle flow upwellings related to the Calabrian slab (modified from Faccenna et al., 2010). |
| In the text | |
|
Fig. 11 Two specific areas of interest showing the interaction between the fault network connectivity and the heat flow. A: the south Upper-Rhine Graben sector, B: northern parts of Bresse Graben The black dashed lines delineate areas of interest described in section 6.5. AuF: Autun Fault, AvF: Avallon Fault, EF: Epinal Fault, JTF: Jura Thrust Fault, LLF: Lalaye-Lubine fault, LSF: La Serre Fault, MMF: Montceau-les-mines Fault, NF: Nomény Fault, RBTZ: Rhine Bresse transfer zone, SF: Sarre Fault, SMF: Ste. Marie-aux-Mines-Retournemer Fault, TF: Tonnerre Fault, TiF: Tignécourt Fault, ToF: Toulon-sur-Arroux-le Creusot Fault, VF: Vittel Fault, VoF: Vosges Fault, VolF: Vologne Fault. |
| In the text | |
|
Fig. 12 Correlation between the stress orientation / regime and the surface heat flow. Stress orientation map of the studied area is based on WSM database; (Heidbach et al., 2018), the colours and the length of the symbol indicate respectively the stress regime and the quality of stress measurements. |
| In the text | |
|
Fig. 13 A: Map of historical (triangles) and instrumental seismicity (rounds), with their respective intensity and magnitudes. Grey round points correspond to historical seismicity sourced from the FCAT-17 (Manchuel et al., 2018) catalogue integrating the SisFrance earthquakes database [SisFrance, BRGM, EDF, IRSN (2023)], while other round points represent data from Instrumental Seismicity Catalogue covers from the Si-Hex project (Cara et al., 2015). B: Depth and focal mechanisms of the seism. Depth of seismicity is from SisFrance earthquakes database (https://www.sisfrance.net/), and the selected focal mechanism sourced from Mazzotti et al. (2021). Traces of potentially active faults were obtained through the BDFA Database (IRSN). |
| In the text | |
|
Fig. 14 Synthetic map showing lithospheric faults, localstrike-slip stress orientations, fault activity, surface heat flow distributions, and the occurrence of thermal and mineral springs. |
| In the text | |
Current usage metrics show cumulative count of Article Views (full-text article views including HTML views, PDF and ePub downloads, according to the available data) and Abstracts Views on Vision4Press platform.
Data correspond to usage on the plateform after 2015. The current usage metrics is available 48-96 hours after online publication and is updated daily on week days.
Initial download of the metrics may take a while.