")
")
Fig. 3
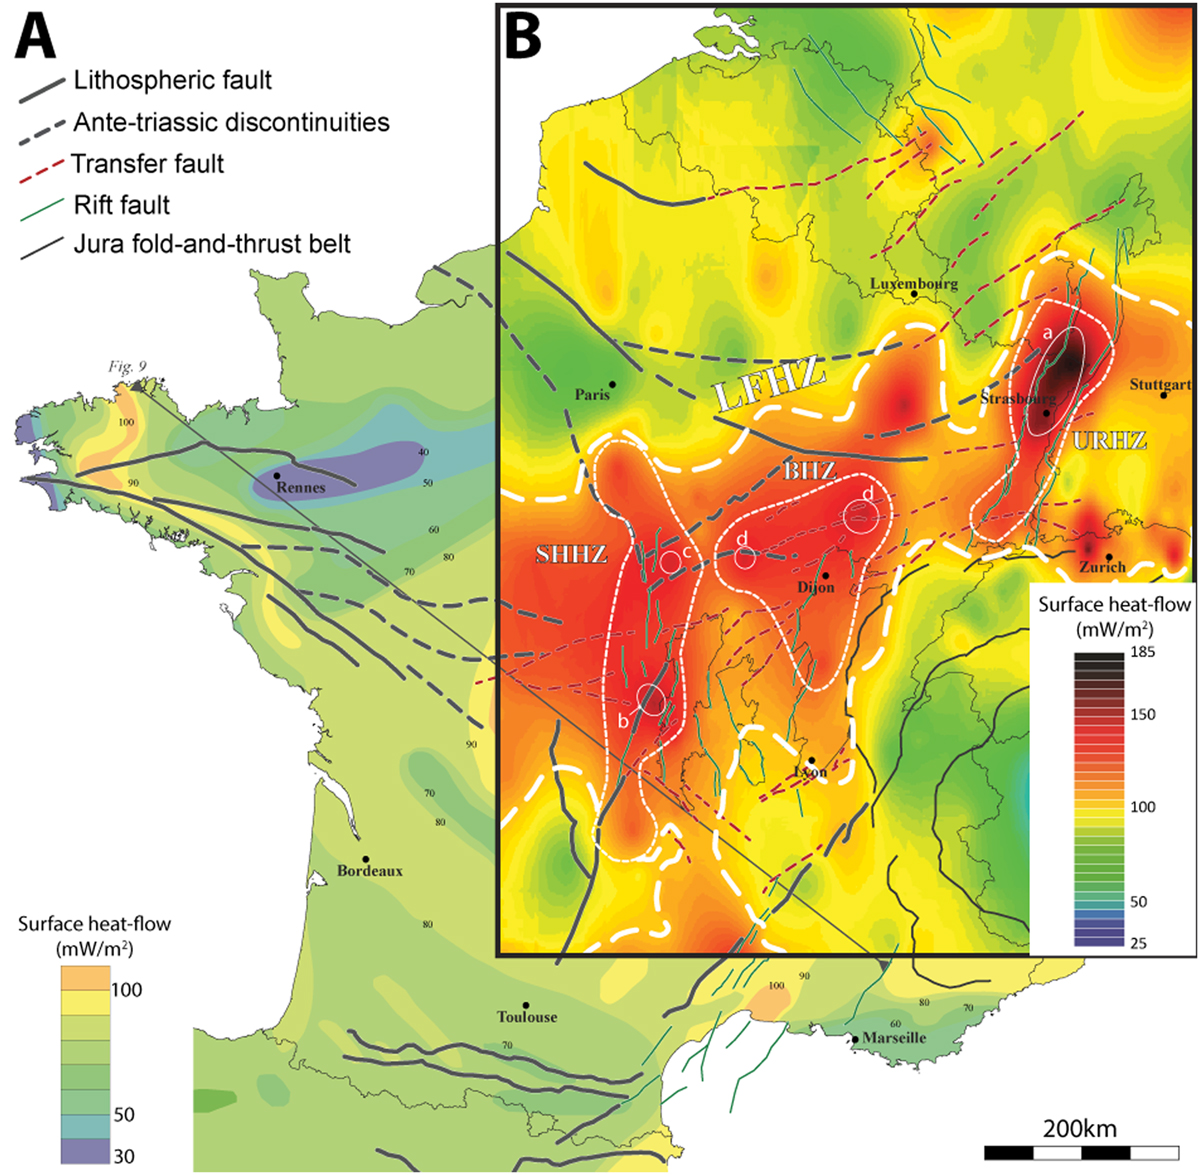
Download original image
Interpolated maps of surface heat flow data. A: modified from Lucazeau and Vasseur (1989), and B: interpolated from The Global Heat Flow Database: Update 2023. For more details on heat flow data extrapolation, see Annexe 1. The white dashed lines correspond to the heat zone contours, thick and thin dashed line correspond respectively to large-scale and small-scale heat flow anomaly. LFHZ : Low Frequency Heat zone, SHHZ: Sillon Houiller Heat Zone, BHZ: Burgundy Heat Zone, URHZ: Upper Rhine Heat Zone.
Current usage metrics show cumulative count of Article Views (full-text article views including HTML views, PDF and ePub downloads, according to the available data) and Abstracts Views on Vision4Press platform.
Data correspond to usage on the plateform after 2015. The current usage metrics is available 48-96 hours after online publication and is updated daily on week days.
Initial download of the metrics may take a while.