


Fig. 11
Download original image
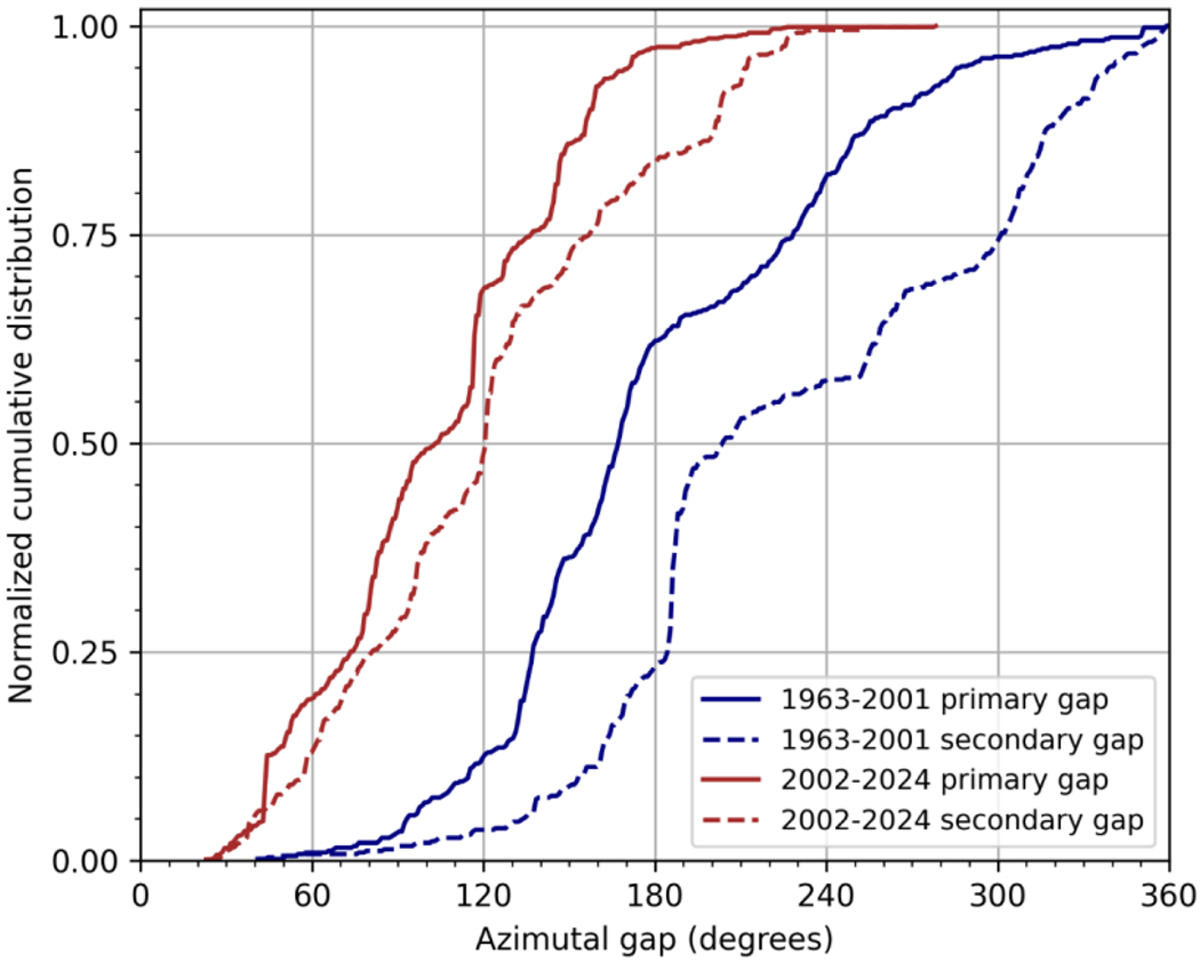
Normalized cumulative distribution of the primary (solid line) and secondary (dashed line) azimuthal gaps of epicenter locations for 1963-2001 (blue) and 2002-2023 (red) periods.
Distribution cumulée normalisée des gaps azimutaux primaires (ligne continue) et secondaires (ligne pointillée) des localisations d’épicentres pour les périodes 1963-2001 (bleu) et 2002-2023 (rouge).
Current usage metrics show cumulative count of Article Views (full-text article views including HTML views, PDF and ePub downloads, according to the available data) and Abstracts Views on Vision4Press platform.
Data correspond to usage on the plateform after 2015. The current usage metrics is available 48-96 hours after online publication and is updated daily on week days.
Initial download of the metrics may take a while.