


| Issue |
BSGF - Earth Sci. Bull.
Volume 197, 2026
|
|
|---|---|---|
| Article Number | 16 | |
| Number of page(s) | 17 | |
| DOI | https://doi.org/10.1051/bsgf/2026007 | |
| Published online | 29 July 2026 | |
20 years of seismic monitoring dedicated to the future French industrial centre for deep geological disposal (Cigéo)
20 ans d’exploitation d’un réseau sismique dédié au futur centre de stockage géologique profond (Cigéo)
1
CEA, DAM, DIF, F-91297 Arpajon, France
2
Andra, 1/7, rue Jean Monnet, Parc de la Croix-Blanche, 92298 Châtenay-Malabry, France
* Corresponding author: This email address is being protected from spambots. You need JavaScript enabled to view it.
Received:
28
November
2025
Accepted:
23
April
2026
Abstract
The Cigéo project, led by the French National Radioactive Waste Management Agency (Andra), involves the future disposal of high-level and long-lived radioactive waste in a deep geological repository. The site is located between the departments of Meuse and Haute-Marne in north-eastern France.
In order to better monitor local seismicity and enhance the discrimination between natural and anthropogenic seismic events in the vicinity (<40 km) of the future Cigéo site, a dedicated network of four seismic stations – known as the Réseau d'Ecoute Sismique (RES) – was installed in 2002 and has been operated since then by the French Alternative Energies and Atomic Energy Commission (CEA). Over the past 60 years, the CEA has recorded 268 natural seismic events within a 90 km radius of the Cigéo site, with the largest reaching a local magnitude (ML) of 3.9. The closest recorded earthquake occurred about 20 km from the site, with a magnitude of ML 1.7.
Historical and early instrumental records indicated that seismic activity in this region was low, a finding confirmed following the implementation of the RES network which significantly improved the detection and location of small earthquakes and identification of numerous quarry explosions in this region. This enhancement has finally increased the number of seismic events processed annually with more than 1,000 quarry blasts detected annually and allowed to reduce the completeness local magnitude down to approximately ML 1.5.
We highlight the improvements in terms of event location and hypocentral depth accuracy provided by the RES network by comparing the median primary and secondary azimuthal gaps and the dimensions of the error ellipses before and after its deployment. Furthermore, we relocate the entire catalogue using a 3D location algorithm along with a 3D global velocity model to obtain more reliable estimates of event locations and hypocentre depth and to better quantify the uncertainties.
Résumé
Le projet Cigéo, piloté par l’Agence nationale pour la gestion des déchets radioactifs (Andra), concerne le stockage des déchets radioactifs de haute activité et à vie longue dans un centre de stockage géologique profond. Le site est situé à la frontière des départements de la Meuse et de la Haute-Marne, dans le nord-est de la France.
Afin d’améliorer la surveillance de la sismicité locale et de mieux distinguer les événements naturels des événements anthropiques dans un rayon de moins de 40 km autour du futur site de Cigéo, un réseau dédié de quatre stations sismiques – appelé Réseau d’Écoute Sismique (RES) – a été installé en 2002 et est exploité depuis par le Commissariat à l’énergie atomique et aux énergies alternatives (CEA). Depuis les années 60 dernières années, le CEA a enregistré 268 événements sismiques naturels dans un rayon de 90 km autour du site de Cigéo, le plus important atteignant une magnitude locale (ML) de 3,9. Le séisme enregistré le plus proche du site s’est produit à environ 20 km, avec une magnitude de ML 1,7.
Les archives historiques et les premières données instrumentales indiquaient une faible activité sismique dans cette région, un constat confirmé après la mise en place du réseau RES. Cependant, ce réseau a également permis d’améliorer significativement la détection et la localisation des petits séismes ainsi que des nombreuses explosions de carrières. Cette amélioration a augmenté le nombre d’événements sismiques traités annuellement et a réduit la magnitude de complétude à environ ML 1,5.
Nous mettons en évidence les améliorations apportées par le réseau RES en matière de localisation des événements et de précision des profondeurs hypocentrales, en comparant les écarts azimutaux médians et les dimensions des ellipses d’incertitudes avant et après son déploiement. Par ailleurs, nous avons relocalisé l’ensemble du catalogue en utilisant un algorithme de localisation 3D combiné à un modèle de vitesse globale 3D, afin d’obtenir des estimations plus fiables des localisations des événements et des profondeurs des hypocentres, et de mieux quantifier les incertitudes associées.
Key words: seismic bulletin / seismic network / discrimination / earthquake / quarry blast / Cigéo
Mots clés : bulletin de sismicité / réseau sismique / discrimination / séisme / tir de carrière / Cigéo
© EDP Sciences, 2026
 This is an Open Access article distributed under the terms of the Creative Commons Attribution License (https://creativecommons.org/licenses/by/4.0), which permits unrestricted use, distribution, and reproduction in any medium, provided the original work is properly cited.
1 Introduction
Seismic monitoring is fundamental to assessing the long-term safety of nuclear facilities (e.g., Berge-Thierry et al., 2017, in the French context). The same is true when assessing the safety of radioactive waste disposal, especially in France, where it is governed by the Règle Fondamentale de Sûreté RFS 2001-01 (ASN, 2001) and international recommendations, such as the IAEA's SSG-14 safety guide (IAEA, 2011). The seismic monitoring allows to characterize local and regional seismic activity, identify active faults, and estimate the recurrence frequencies of significant earthquakes and their ground motion parameters. Documenting active seismotectonic and tectonic structures is essential for evaluating the potential for fault reactivation near facilities. These analyses must be accompanied by an assessment of the current stress field, which determines the potential behavior (seismogenic or non-seismogenic) of the geological structures which accommodate the deformation. All of this data is used to analyze seismic hazards, justify the choice of storage sites, and define design and monitoring requirements throughout the repository's lifetime.
In 2002, CEA and ANDRA initiated a contract (French National Agency for Radioactive Waste Management) to install a dedicated seismic network in northeastern France around the Industrial Geological Storage Center (Cigéo), a deep geological disposal facility for radioactive waste to be built in northeastern France. The main objective was to better characterize the local (<100 km) seismicity and to better discriminate between natural (earthquakes) and artificial (quarry blasts) events around Cigéo site.
The aim of this article is not to present the seismic hazard at the site - a component of the documents submitted by the operator to the nuclear safety authority - but it does document one of its input elements: the natural and artificial micro-earthquakes in the vicinity of the storage site, and particularly the seismicity monitored by a dedicated network of stations that complements the national seismological network since 2002. It first introduces the seismotectonic context, and the historical and instrumental earthquakes documented in part by the national seismological network. It then focuses on the recent contributions made by the installation of several stations to the mission of characterizing local microseismicity and discriminating between natural and artificial earthquakes.
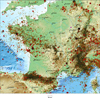 |
Fig. 1 1963-2023 natural seismicity in French metropolitan area (Mazet-Roux, 2025). The purple square indicates Cigéo site. The white rectangle shows the area represented on Figures 2 and S1. Sismicité naturelle en France Métropolitaine entre 1963 et 2023 (Mazet-Roux, 2025). Le cercle rose indique le site de Cigéo. Le rectangle blanc délimite la zone représentée sur les figures 2 et S1. |
2 Cigéo project in its geological context
The French National Radioactive Waste Management Agency (Andra) is responsible for identifying, implementing, and ensuring safe management solutions for all French radioactive waste, in order to protect present and future generations from the risks inherent in these substances.
Studies have been conducted for over thirty years to find solutions for the sustainable management of radioactive waste that does not yet have a definitive disposal method (Delay et al., 2020; Leverd, 2024).
To this end, the Industrial Geological Storage Center (Cigéo) will allow the storage of long-lived, highly and intermediate radioactive waste (HL and IL-LLW) in a deep geological formation (over 500 m deep). The host layer is a claystone whose properties enable it to confine the radionuclides contained in the waste for very long periods of time.
The Cigéo facility will be built in the eastern part of the Paris Basin (between the departments of Meuse and Haute-Marne), characterized by a very stable geological environment and very low seismicity (Fig. 1). This geodynamic context arises from the fact that the Paris Basin rests on the West European craton, which is a rigid and stable block in isostatic equilibrium, protected from any influence, even minor, of the Alpine collisions and associated transient phenomena. It is one of the most stable geological zones of the West European platform.
Indeed, the eastern margin of the Paris Basin develops West of the Vosges mountain massif. It exposes a sedimentary cover overlying a crystalline basement (e.g., Guillocheau et al., 2000). Faults affecting both the basement and the sedimentary sequence are predominantly subvertical. The most recent phases of significant deformation and fracturing are associated with Oligocene rifting, although limited evidence of Miocene activity has been reported (Blaise et al., 2022). To date, no indicators of recent tectonic activity have been identified, even along optimally oriented fault segments that would be most prone to reactivation during favorable phases of glacial–interglacial cycles (Damon et al., 2024), suggesting that the inherited fault systems are currently inactive. Consistently, present-day deformation derived from GNSS observations remains unresolved, as strain rates fall below the current detection threshold of geodetic measurements (e.g., Masson et al., 2019; Doubre et al., 2021; Henrion et al., 2020). At the more local scale of the Andra perimeter and Cigéo site, the cover is unaffected by the fault systems previously described. The clay formation studied by Andra, in particular by its Underground Research Laboratory in Bure (Meuse), was deposited around 160 million years ago. This formation, known as Callovo-Oxfordian (COx), is homogeneous over a large area and very thick (more than 130 meters). No faults affecting this layer have been identified in the studied area. The only known faults are inactive and located outside this area (e.g., Marne fault, Poissons fault, Gondrecourt graben).
3 Seismic stations in the north-east of France
3.1 The CEA and the RES seismic networks
CEA has been operating a metropolitan seismic network since the 1960’s for two purposes: the detection and characterization of explosions and the monitoring of the natural seismicity. This network was mainly initiated to detect and characterize remote nuclear tests. Despite the elevated rate of regional quarry blasts or mine clearance it detects, this nationwide network document also the seismic activity in the metropolitan area (Duverger et al., 2021). Accordingly, CEA network represents the first and most long-standing permanent seismic network installed in metropolitan France (Nicolas et al., 1990).
At the end of 2024, the CEA seismic network comprises 44 stations, located in the French metropolitan area. The network is primarily comprised of vertical short-period sensors (ZM500), which have been developed by CEA (Larsonnier et al., 2019). Three of the aforementioned stations are equipped with two additional horizontal short-period sensors. Fifteen of these stations are equipped with a collocated broadband sensor, comprising 11 Nanometrics Trillium T120 and 4 Kinemetrics STS-2. In accordance with the Epos-France (1962) framework, the real-time data from thirteen of these stations are shared with the French seismological community and accessible through the Epos-France (1962) web services (see Appendix for a full list of stations).
In 2002, the contract between CEA with Andra started. CEA installed the initial three stations (named MEZF, RFYF and SFTF) of the RES (Réseau d’Ecoute Sismique) network and equipped them with Sercel L-4C 3D 3-component short-period sensors (Tabs. S1,and S2; Fig. 2).
In 2008, RFYF station became too noisy as a consequence of the installation of wind turbines implemented less than 1 km away from the station. Consequently, the station was dismantled and replaced with a new three-component short-period sensor (L-4C 3D) at PAGF station, 20 km ESE of RFYF site. In 2014, SAVF station constituted the final addition to the RES network, also equipped with a Sercel L-4C 3D sensor (Tabs. S1,and S2; Fig. 2).
In 2017, station THEF, maintained so far by the L'Ecole et Observatoire des Sciences de la Terre (EOST) in Strasbourg, was stopped, and the CEA installed a new station, ETNF, 4.5 km NE of THEF, to augment its national network and to benefit to the RES project. This new station was equipped with a Trillium T120 broadband sensor (Tabs. S1 and S2; Fig. 2).
Subsequently, SFTF, PAGF and SAVF stations underwent upgrades in December 2018, July 2020 and May 2023, respectively. The short-period sensors were replaced with Trillium T120 broadband sensors. Moreover, the PAGF and SAVF stations have been enhanced with the addition of a short-period vertical sensor (ZM500), which, based on our experience, offers a better signal-to-noise ratio for weak quarry blasts than broadband sensors (Tabs. S1 and S2; Fig. 2).
The complete timeline of installation and upgrade of RES seismic stations is presented in Table S2.
The data acquired at SAVF and ETNF are currently accessible in real time via the Epos-France web services (Epos-France, 1962).
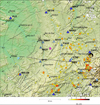 |
Fig. 2 Seismic stations in the northeastern France. Dark blue triangles: Epos-France (1962) stations. Light blue triangles: CEA stations. Black dots mark RES stations. White crosses correspond to closed stations in 2025. Dashed black circle indicate a distance of 110 km around Cigéo site (pink circle). French departments are delineated in dark grey. Black lines shows major and important seismic faults from BDFA database (Jomard et al., 2017). Stations sismiques dans le nord-est de la France. Triangles bleus foncés : stations Epos-France (1962). Triangles bleus clairs : stations CEA. Points noirs : stations RES. Croix blanches : stations fermées en 2025. Le cercle noir en pointillés indique une distance de 110 km autour du site Cigéo (cercle rose). Les départements français sont délimités en gris foncé. Les lignes noires représentent les principales failles sismiques issues de la base de données BDFA (Jomard et al., 2017). |
3.2 The Epos-France permanent broadband network
With Epos-France infrastructure (Epos-France, 1962), the Resif-RLBP seismic network (Réseau Large Bande Permanent) is a national network of broadband seismometers covering mainland France and its overseas territories (RESIF, 2018). It is dedicated to studying the Earth's structure and dynamics through seismic and geodetic data. The RLBP network aims to provide high-quality, continuous seismic data to understand seismicity in France, improve hazard assessment, and support broader research on Earth’s crust and mantle (Epos-France, 1962). The Resif-RLBP network was established in the 2000's to centralize and coordinate seismic monitoring efforts in France. Initially, France's seismic stations were managed by various institutions, sometimes with limited coordination.
The Resif-RLBP network now comprises more than 200 stations in metropolitan France. Of these, eight are read by the CEA in the location procedure within the RES project, as they are situated in the vicinity of the Cigéo site (Fig. 2).
Finally, other Resif-RLBP stations outside the area shown on Figure 2, like in the Vosges massif for example, are used for earthquakes on the south-eastern border of the studied area. They undeniably play a role in the improvement of seismic monitoring.
4 Workflow
The procedure used at the CEA to detect and locate seismic events and to discriminate between natural and anthropogenic ones follows the same general workflow to generate the seismic bulletin for France Metropolitan area and which is described in details by Duverger et al. (2021). We present here after how this workflow is adapted to the RES project.
4.1 Detection
In order to detect any seismic event (natural or artificial) occurring in the northeast of France, CEA first uses a real-time analysis and detection software, SeisComP (2008) which is configured to rapidly identify the most significant events in this region. In addition, the analyst performs a manual scan of the continuous waveforms from both the RES and CEA stations in order to limit the risk for missing a local earthquake.
Upon detecting an event, the analyst manually identifies the local and regional seismic phases (Pg, Sg, Pn and Sn) and locates the event using an earthquake location algorithm developed by CEA (Nicolas et al., 1990). This algorithm, named locgse, is based on the Geiger method (Geiger, 1912) and utilises a 1D velocity model (Duverger et al., 2021).
In addition to the CEA station, the analyst has access to the waveform of several tens of additional stations in the region, operated by other French and foreign seismic networks via Epos-France (1962) or via GEOFON SeedLink servers (1993) for instance. In order to better constrain the epicentral location and hypocentral depth, the closest stations (within 2°) are selected and integrated into the analysis. In the case of the largest earthquakes or those occurring close to the French border, the analyst incorporates additional phases provided by seismological centres in neighbouring countries (e.g., Germany) on their dedicated website. The final location, hypocentral depth and magnitude of each event are then refined and validated by a senior seismologist, who is also responsible for discriminating between natural and artificial events.
4.2 Discrimination
4.2.1 Discrimination expertise and data sources
Since the 1960s, CEA has been involved in identifying and discriminating between natural and artificial events as part of its activities, and the RES project has benefited from this expertise gained through the time.
Additionally, the RES project has benefited from several studies conducted by CEA on behalf of Andra. These include on-site visits to identify quarries and assess their associated activity, temporary experiment conducted to improve discrimination techniques, and revisions to the regional seismic activity. Moreover, Andra provided CEA with a comprehensive register of active quarries in the region in 2002, augmented by data from the relevant regional administrative services (DRIRE).
4.2.2 Methodology
We briefly summarize below some well-known discrimination criteria used in this study between 2002 and 2023, although we know significant developments have been made in this area through the use of AI-based algorithms, such as convolutional neural networks (CNNs) trained on spectrograms (Hourcade et al., 2023).
Discriminating between event types can be challenging and often requires a collection of consistent evidence. A strong distinguishing factor is timing, as the majority of quarry blasts occur during working hours on weekdays, although some quarries can also operate on weekends.
Seismic signals generated by quarry blasts typically differ from those generated by earthquakes. Blasts produce weak S-waves whereas the seismic signal associated with a tectonic event is primarily composed of S-waves, which are more energetic than P-waves. This results in a low P/S amplitude ratio for tectonic events and high P/S ration for explosive events (Allmann et al., 2008; Bennett and Murphy, 1986; Wuester, 1993). Indeed, explosions are characterized by isotropic compressional waves, which typically result in strong P-waves and a comparatively weak S-wave. Furthermore, at local distances (<150 km), Rayleigh waves (Rg) are very often discernible in the seismic signal associated with quarry blasts (Kiszely et al., 2021) although the production of Rayleigh waves also depends on the geology.
Several other criteria can be relevant in the discrimination process: the observation of a direct short acoustic wave generated by quarry blasts on the seismogram at a time consistent with the epicentral distance is a highly reliable discriminant. Shallow earthquakes can cause a piston-like movement of the ground and generate infrasonic waves in the atmosphere (Blanc, 1989) but explosions near the surface produce more effective infrasound signals (Stump et al., 2002). The deployment of a three-component seismic station, which comprising a vertical sensor and two horizontal sensors, is of paramount importance in the discrimination process. This configuration enables the measurement of an azimuth on the P-wave, which can help to pinpoint a unique possible quarry. A very shallow hypocentral depth, if well-constrained, can provide additional indication of an explosive event. Finally, satellite images (e.g., Google Earth) or on-site pictures (Google Street View) are also often used to examine the site and identify evidence of an active quarry. Table 1 summarizes the main criteria used to distinguish tectonic earthquakes from quarry blasts.
Furthermore, within the category of non-tectonic events, we identify suspected induced events, such as those potentially caused by underground gas extraction or gas storage for example (McGarr et al., 2002; Vilarrasa et al., 2021). It is important to notice that the identification of an induced event is always a subjective task. In general, seismic signals generated by induced events — such as those occurring in a geothermal context — are very similar to those of natural tectonic events because they might trigger earthquakes on existing faults. However, the context of gas storage differs markedly, as this activity is less likely to reactivate existing faults than geothermal operations (Grigoli et al., 2017; Schultz et al., 2020). In gas storage settings, operations are typically conducted within well-characterized reservoirs and are designed to avoid critically stressed faults, so that fault reactivation is not an inherent objective, unlike in geothermal stimulations. Consequently, such operations are generally less likely to induce fault reactivation, although induced seismicity may still occur in the presence of pre-existing critically stressed faults, as illustrated by specific case studies (e.g., Castor gas reservoir; Cesca et al., 2021; Vilarrasa et al., 2021). Finally, one rarely gets the actual proof that an event is induced. Therefore, following the IASPEI Seismic format (Bormann, 2009) these events are always considered as “suspected induced events” (Duverger et al., 2021).
Main criteria used to distinguish tectonic earthquakes from quarry blasts.
Principaux critères utilisés pour distinguer les séismes tectoniques des tirs de carrière.
4.2.3 Known active quarries in northeastern France
Since the start of the RES project, several tens of active quarries have been identified by CEA in the following geographical scope: [47.5°N; 49°N] and [4.5°E; 6.5°E] which corresponds to the commitment with the Andra though this rectangle is not centered on the Cigéo site. Figure 6 shows their geographic position. The full list is available in Table S3.
Some of these quarries are very active, with blasts occurring almost daily. Over time, CEA gained experience in recognizing the individual signature of many of those quarries in the seismograms with a high degree of certainty. Consequently, in agreement with Andra, blasts from 14 quarries, or group of closely located quarries, have been neither picked nor located since 2004 (Fig. 6). Since then, the CEA only provides Andra only with of these specific quarries and the time of their blasts. As a result, the blasts associated with these 14 quarries are not represented on Figure 6, although there are far more numerous that the localized quarry blasts.
4.3 Epicentral location
The primary workflow used to identify seismic events is based on the methodology applied to detect earthquakes in the rest of the metropolitan area. This methodology is also implemented to produce the seismological bulletin for France. A detailed description can be found in Duverger et al. (2021).
The initial determination of hypocenter locations is conducted by an analyst, followed by a review by a seismologist. The 1D velocity model is composed of three layers (Veinante-Delhaye and Santoire, 1980). The crust is comprised of a 0.9 km thick sedimentary subsurface layer overlying a 25 km thick continental crust with a Vp/Vs ratio of 1.69. Consequently, the Moho discontinuity is positioned at a depth of 25.9 km (Tab. S4).
4.4 Hypocentral depth
In the absence of depth phases (e.g., pP, sP), which are not recorded at short distances, a necessary condition to resolve properly the hypocentral depth with a local seismic network requires the availability of at least one station close to the epicenter. For local earthquakes, a rule of thumb is that near stations should not be further away than 2 times the depth in order to correctly estimate the hypocentral depth (Bormann, 2009). This is very often not possible, particularly for regional events. However, this condition is often challenging for most seismic networks. Consequently, in sparse networks, hypocentral depth is rarely well constrained and often defaults to a preset depth determined by the location algorithm.
In the event that the location algorithm is unable to determine the hypocentral depth with sufficient accuracy, the analyst proceeds to test a series of default depths (e.g., 2, 5, 10, 15, and 20 km) with the objective of minimizing the time residuals at the closest stations. In such a case, the depth is then considered to be "fixed" by the analyst.
Contrary to epicentral locations, the accuracy of hypocentral depths is difficult to assess in the absence of close station. The depth of seismic events is rarely determined with accuracy, with the shallowest earthquakes often fixed at a depth of 2 km by CEA location algorithm. Other seismological institutes, such as the BCSF-RéNaSS, use a default depth of 5 km. Alternative algorithms, like iLoc (Bondár and Storchak, 2011), exploit the knowledge of the local seismo-tectonic context to output a default depth that depends on the epicentral location.
As detailed below, in section 6, the depths of the most significant earthquakes in the area are midcrustal around 10-15 km.
4.5 Local magnitude
4.5.1 Definition
The local magnitude ML computed by the CEA since the 60’s is named MLLDG and has been defined in the late 70’s (Duverger et al., 2021). The main formula is as follows:
 (1)
(1)
where
A is the peak-to-peak displacement amplitude in nanometer measured on the Sg wave, in the 0.3-7 Hz frequency band;
T is the period, in seconds, measured between the two peaks (or trough) where the amplitude has been measured;
Q0(Δ) is the attenuation law for Sg waves as a function of epicentral distance. The values are tabulated every 50 km from 95 km to 1445 km (Tab. S5);
CS is the station correction.
4.5.2 Difference with Richter local magnitude
The definition of MLLDG is distinct from that of a classical definition of local magnitude, such as Richter's original definition (1935; 1958) for southern California and the subsequent improvement by Hutton and Boore (1987) for several reasons:
Richter’s magnitude uses the amplitude measured in millimeters simulated on a Wood-Anderson torsion seismometer (Anderson and Wood, 1925) whereas MLLDG formula uses the amplitude in displacement obtained after removing the instrument response.
Richter’s formula does not depend on the period as MLLDG formula does.
The attenuation law (i.e., correction term associated to the distance) are different
As implemented in the CEA location software, MLLDG is only calculated for CEA seismic stations.
These differences result in values of MLLDG that regularly differ from local magnitudes provided by other institutions.
5 Seismicity in the vicinity of Cigéo site
5.1 Significant historical and instrumental earthquakes felt in the vicinity
The nearest region to the Cigéo site producing significant earthquakes well documented by historical and instrumental earthquake catalogs is beyond 90 km, on the western flank of the Vosges Mountains. This region is exposed to a moderate but recurrent seismic activity, particularly from Luxeuil-les-Bains and Remiremont in the South and Rambervillers vicinity to the North, within an approximately 50 km long by 20 km large zone. Within that zone, several earthquakes have been felt since 849 AD, the earliest earthquake documented in the region. Among the most significant events, the 12/05/1682 AD earthquake suspected to happen at close distance from Luxeuil-les-Bains and Remiremont was associated to an Imax of VIII and felt 400 km away. This earthquake is necessarily significant in term of magnitude given the radius of perception and was associated to a Mw macroseismic of 6.30 +/-0.37 and a depth at 17 km in Manchuel et al., 2018. This earthquake was followed by aftershocks of magnitudes around Mw3 that occurred the next day and another felt one year after.
The seismicity in the area was better characterized after an instrumental seismic crisis that lasted more than three months after the 29 December 1984 ML 4.8 Remiremont earthquake. This event was followed by an extended cluster of 125 local earthquakes within 10 days concentrated along a 3 km-long fault plane at depths around 10 km. Their relative relocation documented a spatiotemporal migration of seismicity along the fault plane at 5-10 km/yr (Audin et al., 2002), possibly fluid-driven.
Twenty years later, the 22 February 2003 M 5.4 Rambervillers earthquake affected an area approximately 30 km kilometers northward and was followed by 7 M3.5+ aftershocks within 3 weeks that documented a similar history at 10-15 km midcrustal depth. The magnetotelluric (MT) survey conducted by Bourlange et al., 2012 after the Rambervillers crisis revealed a midcrustal (approximately 10 km- depth) conductivity anomaly, interpreted by the authors as related to the presence of conductive fluids, spatially coinciding with the ruptures of the recent earthquakes, in particular to the Rambervillers earthquake. Their results support a model where sustained fluid-pressure diffusion along a basement fault network help maintain microseismic activity and drives the northward migration of seismic events, from the 1984 Remiremont fault to the Rambervillers fault.
5.2 Instrumental natural seismicity 1963-2023
The region of interest corresponds to 100 km around Cigéo site, but it has been extended to account for errors in epicentral location, especially for earthquakes in the 60s and 70s where the network was very sparse (Tab. S2), but also to include the Remiremont 1984-1985 seismic sequence as well as the Rambervillers 2003 mainshock-aftershock sequence (Got et al., 2011).
Figure 2 shows the 1388 natural seismic events within 110 km around Cigéo site that CEA recorded and located between 1963 and 2023. Ten earthquakes, for which the epicenter location is poorly constrained (major semi-axis of the confidence ellipse larger than 50 km or azimuthal gap greater than 340 degrees), are not represented on the map, considering that the location uncertainty is too high.
Within this catalogue, the largest earthquake is the Rambervillers 2003 event with a MLLDG magnitude of 5.9 (Mw 5.4).
Of these events, an MLLDG magnitude was calculated for 1156 of them. For the rest, only the duration magnitude (MD) was determined. In fact, as mentioned in part 4.5.1, MLLDG cannot be calculated below a distance of 95 km. Therefore, the absence of MLLDG means that the event was not recorded beyond 95 km, so that it was particularly small. Duverger et al. (2021) showed that, when ML cannot be computed, we could reasonably use the MD value to get an estimation of ML.
80% of the seismicity in the region of interest is due to the Remiremont 1984-1985 and Rambervillers 2003, 2007 and 2008 seismic sequences as illustrated by Figure 2. The histogram and seismicity rate shown on Figure 3 and the magnitude versus time distribution shown in by Figure 4 also confirm this result but also show an increasing number of earthquakes after 2002. This corresponds to the implementation of the RES network, which clearly improved the detection capabilities in the region and thus increased the number of small earthquakes in the catalogue.
The 1963-2001 period is dominated by Remiremont 1984-1985 sequence, while the 2002-2023 period is dominated by Rambervillers 2003, 2007-2008 sequences. A consequence is the relative lack of magnitude 3 and above after 2002 compared to 1963-2001. Nevertheless, there seems to be an excess of magnitude 3 and above events in the 1963–1980 period that is not associated with any particular seismic sequence. An evolution in the method used to compute ML before and after the 1980s cannot be excluded. This observation is further supported by the Gutenberg-Richter distributions which illustrate the anomalous number of large earthquakes during this earlier period (Fig. 8).
As most of the seismic activity is located to the east and south-east of the region, more than 90 km from the Cigéo site. If we focus on earthquakes within 90 km of the site, this excludes the Remiremont 1984-1985 and Rambervillers 2003, 2007 and 2008 seismic sequences and leaves only 268 events out of 1388.
Figure 5 shows the distribution of earthquake magnitudes over time from 1963 to 2023, highlighting a significant improvement in detection capabilities following the implementation of the RES network in 2002. Since then, smaller-magnitude events have been increasingly detected. The largest recorded earthquake reached a magnitude of MLLDG 3.9 and occurred on 14 November 1987 at 17:05 UTC, located 89 km SSE of the Cigéo site.
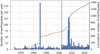 |
Fig. 3 Number of natural earthquakes recorded from 1963 to 2023 within 110 km of Cigéo site. The red vertical line mark the start of the RES network. Black solid line: Cumulative number. Nombre de séismes naturels enregistrés entre 1963 et 2023 dans un rayon de 110 km autour du site Cigéo. La ligne verticale rouge marque le début du réseau RES. Ligne noire continue : nombre cumulé. |
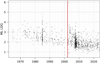 |
Fig. 4 Magnitude (MLLDG) of earthquakes as a function of time from 1963 to 2023 within 110 km of Cigéo site. The red vertical line mark the start of the RES network. Magnitude (MLLDG) des séismes en fonction du temps entre 1963 et 2023 dans un rayon de 110 km autour du site Cigéo. La ligne verticale rouge marque le début du réseau RES. |
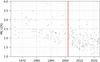 |
Fig. 5 Magnitude (MLLDG) of earthquakes as a function of time from 1963 to 2023 within 90 km of Cigéo site. The red vertical line mark the start of the RES network. Magnitude (MLLDG) des séismes en fonction du temps entre 1963 et 2023 dans un rayon de 90 km autour du site Cigéo La ligne verticale rouge marque le début du réseau RES. |
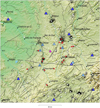 |
Fig. 6 Located quarry blasts 2002-2023 (black crosses) and exact quarry locations (white squares). Red squares mark quarries for which the blasts are not located anymore since 2004. Dark blue triangles: Epos-France (1962) stations. Light blue triangles: CEA stations. Black dots mark RES stations. White crosses correspond to closed stations in 2025. Pink circle indicates Cigéo site. French departments are delineated in dark grey. Black lines shows major and important seismic faults from BDFA database (Jomard et al., 2017). Tirs de carrière localisés entre 2002 et 2023 (croix noires) and position exacte des carrières (carrés blancs). Les carrés rouges indiquent les carrières pour lesquelles les tirs ne sont plus localisés depuis 2004. Triangles bleus foncés : stations Epos-France (1962). Triangles bleus clairs : stations CEA. Points noirs : stations RES. Croix blanches : stations fermées en 2025. Le cercle rose indique le site de Cigéo. Les départements français sont délimités en gris foncé. Les lignes noires représentent les principales failles sismiques issues de la base de données BDFA (Jomard et al., 2017). |
5.3 Suspected induced seismicity
Among the non-tectonic events, 357 are suspected to be induced earthquakes, which we associate to the Storengy underground gas storage facilities near Nancy where natural gas is stored in an aquifer usually during the summer, when the gas consumption is low and extracted during the winter when the gas demand is higher (Storengy, 2021). These events are linked to weak seismic signals and are challenging to pick resulting in a poorly constrained event location. For this reason they are not shown on the maps. Nevertheless, their spatial distribution is confined to an area with no prior known natural seismic activity (Mazet-Roux, 2025) before operations began in 1970 (Storengy, 2021). Most of these suspected induced events occurred in spring 2014, December 2016 and spring 2019 (Fig. 7).
There are several reasons that lead us to consider them induced:
The seismic signal associated with these events, although weak, is very similar among the different events but does not look like the one produced by tectonic earthquakes, for which clear P and S waves more clearly identified.
The geographical distribution of the epicenters delineates a large area to the east of Nancy, near the Cerville gas storage facility, a strategic facility managed by Storengy, whose concession was extended until 18 December 2042 by decree of 2 February 2018 (Légifrance, 2018).
The majority of these events occurred in winter. We think that the seasonal modulation of earthquakes is not a bias of the high frequency seismic noise level variations. We do not exclude that the winter increase of number of events could be related to the withdrawal of the gas from storage, for example for urban heating (Storengy, 2021).
Five of these suspected induced events, recorded in 2017 and 2022, are not associated with the Cerville site but with another area near Saint-Dizier. This site hosts Storengy facilities which resumed gas extraction activities in January 2023 (Storengy, 2023). These five events are particularly weak and their location is poorly constrained but their signals are very similar and they are the only events recorded in this area in our catalogue (Mazet-Roux, 2025). Note that our seismic network has been capable of detecting such small events only after 2002. Finally, this site is known to be a former gas extraction site, which was not expected to be active between 2017 and 2022, so it cannot be definitively stated that these five events were caused by gas extraction or storage activities.
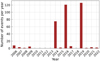 |
Fig. 7 Number of annual suspected induced earthquakes. Nombre annuel de séismes supposés induits. |
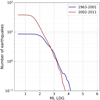 |
Fig. 8 Gutenberg-Richter distribution for 1963-2001 (blue) and 2002-2023 (red) periods. Both periods span over 22 years. Distribution de Gutenberg-Richter pour les périodes 1963-2001 (bleu) et 2002-2023 (rouge). Les deux périodes couvrent chacune 22 ans. |
5.4 Quarry blasts
The vast majority of the seismic events detected and processed by the analysts are quarry blasts. They represent between 87 and 98% of the annual catalogue. From 1963 to 2023, 5500 quarry blasts, carried out by 91 different quarries, have been detected by CEA and are shown on Figure 6 along with their geographic location. Some of them are no longer active and some others have recently started their activity. The activity of quarries can vary over time but we observe a relative stability in the number of quarry blasts in the region over the last 15 years with an average or 100-150 quarry blasts detected and located every year in the region.
In addition, we find an average of 900-1000 quarry blasts from 14 of the most active quarries for which no epicentre location has been determined. In fact, as mentioned in 4.3.2, the CEA no longer calculates the location for 14 of the best known quarries since 2004.
6 Discussion
6.1 Monitoring capacities
As mentioned previously, the implementation of additional stations in the studied area, thanks to the RES and the RLBP networks, has improved the ability to detect and locate smaller events, which in turn has increased the number of earthquakes processed annually by the analysts.
The improvement in seismic detection capabilities is further illustrated by the comparison of Gutenberg-Richter distributions (Gutenberg and Richter, 1949) before and after 2002. Two periods are analyzed: 1963–2001 and 2002–2023 (Fig. 8). The analysis is based on MLLDG magnitudes and includes all earthquakes within a 110 km radius of the Cigéo site, excluding events suspected to be induced. Figure 8 highlights the effect of the increasing number of stations in the region, with the number of detected earthquakes multiplied by a factor of 3.0—from 13.6 earthquakes par year in the first period to 41.4 in the second.
Although the exact value of the magnitude of completeness is difficult to determine, it is evident that it decreased from above 2.0 prior to 2002 to approximately 1.5 (Fig. 8). The b-value seems to differ between the two periods; however, it should be noted that the 1963-2001 period is dominated by Remiremont 1984-1985 sequence, while the 2002-2023 period is dominated by Rambervillers 2003, 2007-2008 sequences. In both cases, each sequence accounts for more than 80% of the seismicity. Consequently, Figure 8 mostly reflects the b-value associated with these individual sequences, and a discussion of the difference between them is beyond the scope of this article. Another consequence of the effects of Remiremont and Rambervillers sequences is the relative lack of magnitude 3 and above after 2002 compared to 1963-2001 (Figs. 4 and 5).
Finally, there appears to be an excess of magnitude 3 and above events in the 1963–1980 period that is not associated with any particular seismic sequence (Figs. 4 and 5). An evolution in the method used to compute ML before and after the 1980s cannot be excluded. This observation is further supported by the Gutenberg-Richter distributions (blue curve, Fig. 8) which illustrate the anomalous number of large earthquakes during this earlier period.
6.2 Location accuracy
This section evaluates the improvements in earthquake location accuracy resulting from the deployment of the RES network in a region that was poorly instrumented prior to 2002. First, we assess the temporal evolution of key location quality indicators, including the size of the confidence ellipse and the average azimuthal gap, to quantify the impact of the RES network. In the second part, we compare hypocenter locations obtained using two different methodologies: our standard approach, which employs a 1D velocity model, and an independent location algorithm, iLoc, (Bondár and McLaughlin, 2009; Bondár and Storchak, 2011) with a more detailed 3D velocity model, RSTT (Myers et al., 2010; Begnaud et al., 2020). This comparison allows us to further assess the robustness and precision of earthquake locations in the region. In the following, we consider tectonic earthquakes that occurred between 1963 and 2023 and that occurred less than 110 km from the Cigéo site (Fig. 2). This corresponds to 1388 earthquakes, of which we exclude 10 for which relocation was not possible due to lack of picks in the database. This results in 1378 relocatable events.
6.2.1 Using geometrical criteria
To quantify the improvement in seismic event location quality, we first analyze the cumulative distribution of the number of phases used in the location process, comparing the periods before and after the implementation of the RES network (Fig. 9). Since the RES network was deployed in 2002, and further strengthened by the development of the RLBP (Epos-France, 1962) network over the past 15 years, the number of seismic stations and recorded phases has increased significantly.
Prior to 2002, the median number of phases (Pg, Pn, Sg and Sn) used for locating earthquakes was 10, whereas during the 2002–2023 period, this number rose to 24 (Fig. 9). An important indicator of location accuracy is the size of the confidence error ellipse. However, it should be noted—as highlighted by Bondár et al. (2009)—that linearized location algorithms tend to underestimate the size of this ellipse, which must be considered when interpreting improvements in location precision. Moreover, the location algorithm used by the CEA (locgse) is not sufficiently documented to assess the robustness of the confidence ellipse. According to our experience, the confidence level of the error ellipse given by locgse should be 68% but the values given below should be treated with caution. A more robust assessment of the size of the error ellipse is carried out in section 6.2.2.
We qualitatively illustrate the improvement in location accuracy by comparing the size of the error ellipse between the two periods. Figure 10 shows the cumulative distribution of the size of the semi major axis of the confidence ellipse for both time periods. The 50th and 95th percentiles before 2002 were 3.7 and 15.8 km compared to 1.4 and 2.8 km after 2002. This result shows that since the contribution of the RES and the RLBP networks, the robustness of the relocation process and the location accuracy have improved significantly.
More objective criteria exist to assess location accuracy, such as the primary and secondary azimuthal gaps (Bormann, 2009), whose cumulative distributions are shown in Figure 11. The improvement in azimuthal coverage is substantial: before 2002, the median secondary gap was 212°, whereas for the 2002–2023 period it decreased to 146°. It is worth noting that these results would be even better if restricted to the most recent years only, i.e., after the RES and RLBP networks were fully operational.
The percentiles associated with each metric for both time periods are summarized in Table 2.
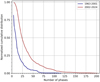 |
Fig. 9 Normalized cumulative distribution of the number of phases used for epicenter location for 1963-2001 (blue) and 2002-2023 (red) periods. Distribution cumulée normalisée du nombre de phases utilisées pour la localisation de l’épicentre pour les périodes 1963-2001 (bleu) et 2002-2023 (rouge). |
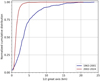 |
Fig. 10 Normalized cumulative distribution of the length of the semi major axis of the 68% confidence ellipse of epicentre locations for 1963-2001 (blue) and 2002-2023 (red) periods. Distribution cumulée normalisée de la longueur du demi-grand axe de l’ellipse de confiance à 68% des localisations d’épicentres pour les périodes 1963-2001 (bleu) et 2002-2023 (rouge). |
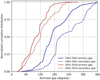 |
Fig. 11 Normalized cumulative distribution of the primary (solid line) and secondary (dashed line) azimuthal gaps of epicenter locations for 1963-2001 (blue) and 2002-2023 (red) periods. Distribution cumulée normalisée des gaps azimutaux primaires (ligne continue) et secondaires (ligne pointillée) des localisations d’épicentres pour les périodes 1963-2001 (bleu) et 2002-2023 (rouge). |
Values of different metrics used to assess epicentre location accuracy, before and after 2002.
Valeurs des différentes métriques utilisées pour évaluer la précision de la localisation des épicentres, avant et après 2002.
6.2.2 Using independent model and algorithm
• 1D vs. 3D locator
To objectively assess the accuracy of earthquake locations, each event was independently relocated using the iLoc algorithm (Bondár and McLaughlin, 2009; Bondár and Storchak, 2011), which is currently used operationally by the International Seismological Centre (ISC) for global seismic data processing (Storchak et al., 2015). iLoc is specifically designed to provide accurate and robust hypocentral solutions by accounting for both observational and model-based uncertainties.
The relocation process with iLoc is structured in two main stages. First, a global search is performed using a stochastic Neighbourhood Algorithm (NA), which discretizes the solution space into a grid. This initial phase aims to identify a reasonable approximation of the hypocentre by exploring multiple potential locations around an initial estimate. For each candidate location, travel time residuals (observed minus calculated) are computed, and the candidate minimizing the sum of squared residuals is selected. This method avoids convergence on local minima and provides a reliable starting point for further refinement. In the second stage, a local linearized optimization based on the Geiger method is applied. This iterative process adjusts the hypocentral coordinates in the direction of decreasing residuals using a gradient descent approach. Iterations continue until the misfit between observed and calculated travel times falls below a predefined threshold, resulting in a stable, optimized location.
As for the depth, iLoc provides depth uncertainties derived from the inversion algorithm, along with the latitude and longitude. Conversely, locgse initially computes the epicentral location by minimizing the residual RMS and subsequently determines the hypocentral depth by testing various depths and selecting the one with the minimum RMS.
One of the key strengths of iLoc lies in its explicit treatment of uncertainties related to travel-time predictions. Unlike conventional location algorithms, iLoc incorporates modeling errors stemming from imperfect velocity models and picking inaccuracies, especially in regions with complex geological structures. These uncertainties are used to weight residuals and influence the optimization, leading to more realistic estimates of hypocentral parameters. Additionally, iLoc provides an approximate posterior probability density function (PDF) around the optimal location, allowing for the derivation of confidence regions (e.g., 90% confidence ellipse), and a meaningful assessment of location uncertainty.
During the relocation process with iLoc, we prevented it to rename the seismic phases during the relocation process by setting the associated DoNotRenamePhase parameter to 1 and we did not use the Neighbourhood Algorithm (NA) and used the locgse solution as the initial location.
• 1D vs. 3D velocity model
Nouibat (2025) published a 3D velocity model for metropolitan France; however, at the time of writing, it could not be easily implemented within the iLoc software. Therefore, in this study, relocations were performed using the pdu202009Du 3D global velocity model available in the Regional Seismic Travel Time (RSTT) package (Myers et al., 2010; Begnaud et al., 2020), which enhances regional resolution by incorporating lateral velocity variations.
RSTT is a global three-dimensional model derived from tomographic inversions and calibrated using a large dataset of regional seismic phases (e.g., Pg, Pn, Sg, Sn). In contrast to conventional one-dimensional velocity models, it accounts for lateral heterogeneities and incorporates path-dependent travel-time uncertainties, leading to more realistic uncertainty estimates. The pdu202009Du model is defined on a global tessellation with an average node spacing of about 1° (∼100 km). However, travel times are computed through continuous interpolation between nodes combined with depth-dependent velocity profiles, so that the effective resolution is not strictly limited by the node spacing but also depends on ray coverage, phase types, and station geometry.
The iLoc-derived locations are compared to those obtained with our standard routine, which uses a 1D velocity model, in order to evaluate the relative performance and robustness of both approaches.
In the following, we statistically compare the locations and focal depths determined by iLoc with those determined by locgse, the CEA earthquake location algorithm with the LDG 1D velocity model. This comparison is made for the two time periods separated by the implementation of the RES network in 2002.
• Differences in epicentral location
Figure 12 illustrates the improvement in location accuracy following the deployment of the RES network, as evidenced by the reduction in the average size of the confidence ellipse. Specifically, the median length of the semi-major axis, as computed by iLoc, decreased from 11.2 km during the period 1963–2001 to 5.5 km for 2002–2023.
Furthermore, Figure 13 compares the event locations obtained using iLoc and those derived from the Locgse algorithm. The results show that the median difference between the two methods remains below 2.5 km across all time periods. Notably, for the 2002–2023 period, this difference never exceeds 10.5 km, further confirming the consistency and reliability of the relocations in the RES-enhanced seismic network.
Figures 10 and 12 show the cumulative distribution of the semi-axis of the 68% confidence error ellipse for Locgse and iLoc, respectively. The semi-axes produced by iLoc are 2.3 to 2.5 times larger than those from Locgse, with median values over the 2002–2023 period of 3.5 km and 1.4 km, respectively (Tab. 2). This discrepancy further illustrates the tendency of linearized location algorithms to underestimate location uncertainty.
Over the 2002–2023 period, 95% of earthquakes have a location accuracy better than 6.4 km.
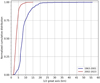 |
Fig. 12 Cumulative distribution of the length of semi-great axis of the 68% confidence ellipse determined by iLoc after relocation. Distribution cumulée de la longueur du demi-grand axe de l’ellipse de confiance à 90% déterminée par iLoc après relocalisation. |
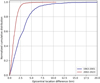 |
Fig. 13 Cumulative distribution of the distance between the epicenters determined by iLoc and locgse. Distribution cumulée de la distance entre les épicentres déterminés par iLoc et locgse. |
• Differences in depth
Figure 14 shows iLoc depths plotted against Locgse depths for the 2002–2023 period. Both algorithms yield a wide range of depths, from 2 to 25 km, with iLoc typically determining hypocentral depths 5–10 km greater than those computed by Locgse. The concentration of blue dots in Figure 14 highlights cases where Locgse uses a depth fixed by the analyst (e.g., 10, 12, and 15 km) in the process of minimizing residuals at the nearest stations. By contrast, when iLoc cannot determine a free depth, it defaults to fixed depths of 10, 13, or 14 km. The median depth difference between iLoc and Locgse depths is 3.9 km for free depths and 8.0 for fixed depths.
The greater depths obtained with iLoc can be attributed to a combination of effects related to both i) the velocity model and ii) the inversion method:
The 1D model used with Locgse, based on a simplified layered structure, may introduce biases arising from an imperfect representation of the medium, which are partly compensated by adjusting the depth of the events.
Furthermore, the two-step inversion procedure of Locgse — first determining the epicentral location and then estimating depth separately — tends to favor shallower solutions.
Conversely, through the use of RSTT, iLoc relies on a 3D velocity model and a simultaneous inversion of all hypocentral parameters, while accounting for travel-time uncertainties, resulting in more consistent and generally deeper hypocentral locations.
Finally, the values obtained are within the range of depths obtained for the best studied mainshocks / aftershocks in the area and correspond broadly to the depths at which the conductivity anomalies and the basement fault networks develop (e.g., Bourlange et al., 2012).
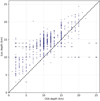 |
Fig. 14 Difference between the hypocentral depths determined by iLoc and locgse. Différence entre les profondeurs hypocentrales déterminées par iLoc et locgse. |
7 Conclusion and perspectives
The RES network, implemented in 2002, was designed to better detect and characterize the natural and artificial seismicity around the Cigéo site.
The data collected by the RES since 2002 and by the academic network RLBP (Epos-France, 1962), which has been built in the 2010’s confirmed the low seismicity rate in the region with 268 natural seismic events within 90 km around of the Cigéo site in 60 years, and the largest earthquake reaching ML 3.9. The closest earthquake to the Cigéo site occurred at a distance of 20 km and was assigned a magnitude ML=1.7.
The RES improved our capacity to detect and locate small earthquakes and more than 1000 quarry explosions a year. As a result, the completeness magnitude has decreased by 0.5 of magnitude unit down to MLLDG 1.5.
The contribution of the RES to the monitoring capacity is also illustrated by the fact that the median number of phases used to locate the epicenter increased from 10 before 2002 to 25 after 2002, and the median primary azimuthal gap decreased from 168° to 104° over the same period.
The relocation of the complete catalogue with iLoc (Bondár and Storchak, 2011) using a 3D global velocity model allowed us to better estimate the location and depth uncertainties and to highlight the contribution of the RES to these achievements.
Supplementary Material
Figure S1. Seismic stations in the north-eastern France. Dark blue triangles: Epos-France (1962) stations. Light blue triangles: CEA stations. Black dots mark RES stations. White crosses correspond to closed stations. Pink circle indicates Cigéo site. French departments are delineated in dark grey. Black lines shows major and important seismic faults from BDFA database (Jomard et al., 2017).
Figure S1. Stations sismiques du nord-est de la France. Triangles bleus foncés : stations Epos-France (1962). Triangles bleus clairs : stations CEA. Points noirs : stations RES. Croix blanches : stations fermées. Le cercle rose indique le site de Cigéo. Les départements français sont délimités en gris foncé. Les lignes noires représentent les principales failles sismiques issues de la base de données BDFA (Jomard et al., 2017).
Table S1. List of RES, CEA and Epos-France (1962) seismic stations in the vincinity of Cigéo site. Stations belonging to the RES network are marked in red.
Table S1. Liste des stations sismiques RES, CEA et Epos-France (1962) à proximité du site Cigéo. Les stations appartenant au réseau RES sont marquées en rouge.
Table S2. Timeline of installation and upgrade of RES seismic stations since 1965. The month of installation/upgrade appears between brackets. T120+ZM stands for Trillium T120 + vertical ZM500.
Table S2. Chronologie de l’installation et des mises à niveau des stations sismiques RES depuis 1965. Le mois d’installation ou de mise à niveau est indiqué entre parenthèses. T120+ZM désigne un Trillium T120 + ZM500 vertical.
Table S3. Quarries in the area of interest for which a blast has been recorded at least once between 1963 and 2023.
Table S3. Carrières dans la zone d’intérêt pour lesquelles au moins un tir a été enregistré entre 1963 et 2023.
Table S4. Velocity model used by the CEA location algorithm. H stands for layer thickness, Vp for P-wave velocity and Vs for S-wave velocity respectively.
Table S4. Modèle de vitesse utilisé par l’algorithme de localisation du CEA. H représente l’épaisseur de la couche, Vp la vitesse des ondes P et Vs la vitesse des ondes S.
Table S5. The distance correction terms used in the MLLDG formula in order to take into account geometrical spreading and anelastic attenuation. Tabulated coefficients of the attenuation of S-waves with epicentral distance (Δ).
Table S5. Termes de correction de distance utilisés dans la formule MLLDG afin de prendre en compte l’étalement géométrique et l’atténuation anélastique. Coefficients tabulés de l’atténuation des ondes S en fonction de la distance épicentrale (Δ).
Access Supplementary MaterialReferences
- Allmann BP, Shearer PM, Hauksson E. 2008. Spectral discrimination between quarry blasts and earthquakes in southern California. Bull Seismol Soc Am 98(4): 2073–2079. [Google Scholar]
- Anderson JA, Wood HO. 1925. Description and theory of the torsion seismometer. Bull Seismol Soc Am 15(1): 72. [Google Scholar]
- ASN - Autorité de sûreté nucléaire. 2001. Règle fondamentale de sûreté RFS 2001-01 : Caractérisation de l’aléa sismique pour la sûreté des installations nucléaires de base. France: ASN. [Google Scholar]
- Audin L, Avouac JP, Flouzat M, Plantet JL. 2002. Fluid‐driven seismicity in a stable tectonic context: the Remiremont fault zone, Vosges, France. Geophys Res Lett 29(6): 13–21. [CrossRef] [Google Scholar]
- Bakun WH, Scotti O. 2006. Regional intensity attenuation models for France and the estimation of magnitude and location of historical earthquakes. Geophys J Int 164: 596–610. [Google Scholar]
- Begnaud ML, Myers SC, Young BA, Hipp JR, Dodge D, Phillips WS. 2020. Updates to the regional seismic travel time (RSTT) model: 1. Tomography Pure Appl Geophys 24 pp. https://doi.org/10.1007/s00024-020-02619-5. [Google Scholar]
- Belinić T, Markušić S. 2017. Empirical criteria for the accuracy of earthquake locations on the Croatian territory. Geofizika 34, https://doi.org/10.15233/gfz.2017.34.5. [Google Scholar]
- Bennett T, Murphy J. 1986. Analysis of seismic discrimination capabilities using regional data from western United States events. Bull Seismol Soc Am 76(4): 1069–1086. [Google Scholar]
- Berge-Thierry C, Hollender F, Guyonnet-Benaize C, Baumont D, Ameri G, Bollinger L. 2017. Challenges ahead for nuclear facility site-specific seismic hazard assessment in France: the alternative energies and the Atomic Energy Commission (CEA) vision. In: Best practices in physics-based fault rupture models for seismic hazard assessment of nuclear installations Cham: Springer International Publishing, pp. 285-309. [Google Scholar]
- Blaise T, Khoudja SAA, Carpentier C, Brigaud B, Missenard Y, Mangenot X, et al. 2022. Far-field brittle deformation record in the eastern Paris Basin (France). Geol Mag 159(11-12): 2095–2109. [Google Scholar]
- Blanc E. 1989. Observations in the upper atmosphere of ionospheric irregularities observed by HF soundings over a powerful acoustic source. Radio Sci 24(3): 279–288. [Google Scholar]
- Bondár I, McLaughlin KL. 2009. A new ground truth data set for seismic studies. Geophys Res Lett 80: 465–472. [Google Scholar]
- Bondár I, Myers SC, Engdahl ER, Bergman EA. 2004. Epicentre accuracy based on seismic network criteria. Geophys J Int 156: 483–496. [Google Scholar]
- Bondár I, Storchak D. 2011. Improved location procedures at the International Seismological Centre. Geophys J Int 186: 1220–1244. [Google Scholar]
- Bondár I, Engdahl R, Villaseñor A, Harris J, Storchak D. 2015. The ISC-GEM global instrumental earthquake catalogue (1900-2009): introduction. Phys Earth Planet Inter. [Google Scholar]
- Bondár I, Mclaughlin K. 2009. Seismic location bias and uncertainty in the presence of correlated and non-gaussian travel-time errors. Bull Seismol Soc Am 99: 172–193. https://doi.org/10.1785/0120080922. [Google Scholar]
- Bormann P. (Ed.). 2009. New Manual of Seismological Observatory Practice (NMSOP-1). Potsdam: IASPEI, GFZ German Research Centre for Geosciences. [Google Scholar]
- Bourlange S, Mekkawi M, Conin M, Schnegg PA. 2012. Magnetotelluric study of the Remiremont-Epinal-Rambervillers zone of migrating seismicity, Vosges (France). Bull Soc Géol Fr 183(5): 461–470. [Google Scholar]
- Cara M, Cansi Y, Schlupp A, Arroucau P, Béthoux N, Beucler E, et al. 2015. SI-Hex: a new catalogue of instrumental seismicity for metropolitan France. Bull Soc Géol Fr 186(1): 3–19. [Google Scholar]
- Cara M, Denieul M, Sèbe O, Delouis B, Cansi Y, Schlupp A. 2017. Magnitude Mw in metropolitan France. J Seismol 21(3): 551–565. [Google Scholar]
- Cesca S, Stich D, Grigoli F, Vuan A, López-Comino JÁ, Niemz P, et al. 2021. Seismicity at the Castor gas reservoir driven by pore pressure diffusion and asperities loading. Nat Commun 12(1): 4783. [Google Scholar]
- Chantraine J, Autran A, Cavelier C. 2003. Carte géologique de la France à l’échelle du millionième. Orléans: BRGM. [Google Scholar]
- Damon A, Mazzotti S, Vernant P, Ego F, Baumont D, Grosset J, et al. 2024. Impact des contraintes induites par les glaciations et l’érosion sur la stabilité des failles du nord de la France. Lettre d'information Epos-France, (2): 12-13. [Google Scholar]
- Delay J, Salsac MD, Huret E, Dewonck S, Bosgiraud JM, Armand G, WM2020 Conference. 2020. ANDRA’S underground research laboratory in bure: major role in the Cigéo development – 20005. [Google Scholar]
- Denieul M, Sèbe O, Cara M, Cansi Y. 2015. Mw from crustal coda waves recorded on analog seismograms. Bull Seismol Soc Am 105(2A): 831–849. [Google Scholar]
- Doubre C, Meghraoui M, Masson F, Lambotte S, Jund H, de Berc MB, et al. 2021. Seismotectonics in Northeastern France and neighboring regions. C R Géosci 353(S1): 153–185. [Google Scholar]
- Drouet S, Ameri G, Le Dortz K, Secanell R, Senfaute G. 2020. A probabilistic seismic hazard map for the metropolitan France. Bull Earthq Eng 18(5): 1865–1898. [Google Scholar]
- Duverger C, Mazet-Roux G, Bollinger L, Guilhem-Trilla A, Vallage A, Hernandez B, et al. 2021. A decade of seismicity in metropolitan France (2010-2019): the CEA/LDG methodologies and observations. BSGF - Earth Sciences Bulletin 192: 25. https://doi.org/10.1051/bsgf/2021014. [Google Scholar]
- Epos-France. 1962. Epos-France Broad-band network (RLBP) [Data set]. Epos-France Seismological Data Centre. https://doi.org/10.15778/RESIF.FR. [Google Scholar]
- Geiger L. 1912. Probability method for the determination of earthquake Epicenters from the arrival time only. Bull St. Louis Univ 8: 56–71. [Google Scholar]
- GEOFON Data Centre. 1993. GEOFON Seismic Network. GFZ Data Services. Dataset/Seismic Network. https://doi.org/10.14470/TR560404. [Google Scholar]
- Got JL, Monteiller V, Guilbert J, Marsan D, Cansi Y, Maillard C, et al. 2011. Strain localization and fluid migration from earthquake relocation and seismicity analysis in the western Vosges (France). Geophys J Int 185(1): 365–384. [Google Scholar]
- Grigoli F, Cesca S, Priolo E, Rinaldi AP, Clinton JF, Stabile TA, et al. 2017. Current challenges in monitoring, discrimination, and management of induced seismicity related to underground industrial activities: a European perspective. Rev Geophys 55(2): 310–340. [Google Scholar]
- Guillocheau F, Robin C, Allemand P, Bourquin S, Brault N, Dromart G, et al. 2000. Meso-Cenozoic geodynamic evolution of the Paris Basin: 3D stratigraphic constraints. Geodin Acta 13(4): 189–245. [Google Scholar]
- Gutenberg B, Richter CF. 1949. Seismicity of the earth and associated phenomena. Princeton University Press. [Google Scholar]
- Helmholtz-Centre Potsdam - GFZ German Research Centre for Geosciences and gempa GmbH. 2008. The SeisComP seismological software package. GFZ Data Services. https://doi.org/10.5880/GFZ.2.4.2020.003. [Google Scholar]
- Henrion E, Masson F, Doubre C, Ulrich P, Meghraoui M. 2020. Present-day deformation in the Upper Rhine Graben from GNSS data. Geophys J Int 223(1): 599–611. [Google Scholar]
- Hourcade C, Bonnin M, Beucler E. 2023. New CNN-based tool to discriminate anthropogenic from natural low magnitude seismic events. Geophys J Int 232(3): 2119–2132. https://doi.org/10.1093/gji/ggac441. [Google Scholar]
- Hutton LK, Boore DM. 1987. The ML scale in Southern California. Bull Seismol Soc Am 77(6): 2074–2094. [Google Scholar]
- IAEA. 2011. Geological disposal facilities for radioactive waste (IAEA Safety Standards Series No. SSG-14). Vienna: International Atomic Energy Agency. [Google Scholar]
- Jomard H, Cushing EM, Palumbo L, Baize S, David C, Chartier T. 2017. Transposing an active fault database into a seismic hazard fault model for nuclear facilities – Part 1: Building a database of potentially active faults (BDFA) for metropolitan France. Nat Hazards Earth Syst Sci 17: 1573–1584. [CrossRef] [Google Scholar]
- Kiszely M, Süle B, Mónus P, et al. 2021. Discrimination between local earthquakes and quarry blasts in the Vértes Mountains, Hungary. Acta Geod Geophys 56: 523–537. https://doi.org/10.1007/s40328-021-00346-4. [Google Scholar]
- Larsonnier F, Rouillé G, Bartoli C, Klaus L, Begoff P. 2019. Comparison on seismometer sensitivity following ISO 16063-11 standard. International Congress of Metrology https://doi.org/10.1051/metrology/201927003. [Google Scholar]
- Légifrance. 2018. “Décret Du 2 Février 2018 Prolongeant La Concession de Stockage Souterrain de Gaz Naturel, Dite “Concession de Cerville - Velaine” (Meurthe-Et-Moselle), à La Société ENGIE SA - Légifrance.” Gouv.fr, 2018, www.legifrance.gouv.fr/jorf/id/JORFTEXT000036570395. Accessed 23 May 2025. [Google Scholar]
- Leverd Pascal-Claude. 2024. The world leading deep geological repository projects: a synthetic description of the high-level waste long-term management facilities programed in Finland, Sweden, France and Switzerland and an overview of the deep geological repository site selection M. J Nucl Fuel Cycle Waste Technol 22(4): 503–522. https://doi.org/10.7733/jnfcwt.2024.040. [Google Scholar]
- Manchuel K, Traversa P, Baumont D, Cara M, Nayman E, Durouchoux C. 2018. The French seismic CATalogue (FCAT-17). Bull Earthq Eng 16(6): 2227–2251. [Google Scholar]
- Masson C, Mazzotti S, Vernant P, Doerflinger E. 2019. Extracting small deformation beyond individual station precision from dense Global Navigation Satellite System (GNSS) networks in France and western Europe. Solid Earth 10(6): 1905–1920. [CrossRef] [Google Scholar]
- Mayor J, Traversa P, Calvet M, Margerin L. 2018. Tomography of crustal seismic attenuation in Metropolitan France: implications for seismicity analysis. Bull Earthq Eng 16(6): 2195–2210. [Google Scholar]
- Mazet-Roux G. 2025. 1963-2023 seismicity catalogue of metropolitan France. https://doi.org/10.57932/41bbc272-cb46-438d-a125-9a475077adfd. [Google Scholar]
- McGarr A, Simpson D, Seeber L. 2002. Case histories of induced and triggered seismicity. In: International geophysics Academic Press, Vol. 81, pp. 647-661. [Google Scholar]
- Myers SC, Begnaud ML, Ballard S, Pasyanos ME, Phillips WS, Ramirez AL, et al. 2010. A crust and upper mantle model of Eurasia and North Africa for Pn travel time calculation. Bull Seismol Soc Am 100(2): 640–656. https://doi.org/10.1785/0120090198. [Google Scholar]
- Nicolas M, Santoire JP, Delpech PY. 1990. Intraplate seismicity: new seismotectonic data in Western Europe. Tectonophysics 179(1-2): 27–53. [Google Scholar]
- Nouibat A, Zaroli C, Lambotte S. 2025. Ambient noise imaging of Western Europe from combining linear SOLA Backus–Gilbert inference and non-linear probabilistic approaches. Geophys Res Lett 52: e2025GL115623. https://doi.org/10.1029/2025GL115623. [Google Scholar]
- RESIF. 2018. CEA/DASE broad-band permanent network in metropolitan France [Data set]. RESIF - Réseau Sismologique et géodésique Français. https://doi.org/10.15778/RESIF.RD. [Google Scholar]
- Richter CF. 1958. Elementary seismology. San Francisco, California: W. H. Freeman and Co., 578 pp. [Google Scholar]
- Richter CF. 1935. An instrumental earthquake magnitude scale. Bull Seismol Soc Am 25: 1–32. [Google Scholar]
- Schultz R, Skoumal RJ, Brudzinski MR, Eaton D, Baptie B, Ellsworth W. 2020. Hydraulic fracturing-induced seismicity. Rev Geophys 58: e2019RG000695. https://doi.org/10.1029/2019RG000695. [Google Scholar]
- Storengy. 2021. www.storengy.fr/en/our-sites/cerville. Accessed 23 May 2025. [Google Scholar]
- Storengy. 2023. Storengy press release, https://www.storengy.fr/fr/medias/actualites/storengy-redemarre-son-site-de-stockage-de-trois-fontaines. Accessed 23 May 2025. [Google Scholar]
- Stump BW, Hedlin MA, Pearson DC, Hsu V. 2002. Characterization of mining explosions at regional distances: implications with the international monitoring system. Rev Geophys 40(4): 2–11. [Google Scholar]
- Veinante-Delhaye A. and Santoire JP, 1980. Sismicité récente de l’arc sud-armoricain et du nord-ouest du Massif-central. Mécanismes au foyer et tectonique. Bull Soc Géol Fr., (22), 1: 93–102. [Google Scholar]
- Vilarrasa V, De Simone S, Carrera J, Villaseñor A. 2021. Unraveling the causes of the seismicity induced by underground gas storage at Castor, Spain. Geophys Res Lett 48(7): e2020GL092038. [Google Scholar]
- Wessel P, Smith WHF. 1998. New, improved version of the generic mapping tools released. EOS Trans AGU 79: 579. [Google Scholar]
- Wuester J. 1993. Discrimination of chemical explosions and earthquakes in central Europe—a case study. Bull Seismol Soc Am 83: 1184–1212. [Google Scholar]
Cite this article as: Mazet-Roux G, Bollinger L, Pantobe L, and Ego F. 2026. 20 years of seismic monitoring dedicated to the future French industrial centre for deep geological disposal (Cigéo), BSGF - Earth Sciences Bulletin 197: 16. https://doi.org/10.1051/bsgf/2026007
All Tables
Main criteria used to distinguish tectonic earthquakes from quarry blasts.
Principaux critères utilisés pour distinguer les séismes tectoniques des tirs de carrière.
Values of different metrics used to assess epicentre location accuracy, before and after 2002.
Valeurs des différentes métriques utilisées pour évaluer la précision de la localisation des épicentres, avant et après 2002.
All Figures
|
Fig. 1 1963-2023 natural seismicity in French metropolitan area (Mazet-Roux, 2025). The purple square indicates Cigéo site. The white rectangle shows the area represented on Figures 2 and S1. Sismicité naturelle en France Métropolitaine entre 1963 et 2023 (Mazet-Roux, 2025). Le cercle rose indique le site de Cigéo. Le rectangle blanc délimite la zone représentée sur les figures 2 et S1. |
| In the text | |
|
Fig. 2 Seismic stations in the northeastern France. Dark blue triangles: Epos-France (1962) stations. Light blue triangles: CEA stations. Black dots mark RES stations. White crosses correspond to closed stations in 2025. Dashed black circle indicate a distance of 110 km around Cigéo site (pink circle). French departments are delineated in dark grey. Black lines shows major and important seismic faults from BDFA database (Jomard et al., 2017). Stations sismiques dans le nord-est de la France. Triangles bleus foncés : stations Epos-France (1962). Triangles bleus clairs : stations CEA. Points noirs : stations RES. Croix blanches : stations fermées en 2025. Le cercle noir en pointillés indique une distance de 110 km autour du site Cigéo (cercle rose). Les départements français sont délimités en gris foncé. Les lignes noires représentent les principales failles sismiques issues de la base de données BDFA (Jomard et al., 2017). |
| In the text | |
|
Fig. 3 Number of natural earthquakes recorded from 1963 to 2023 within 110 km of Cigéo site. The red vertical line mark the start of the RES network. Black solid line: Cumulative number. Nombre de séismes naturels enregistrés entre 1963 et 2023 dans un rayon de 110 km autour du site Cigéo. La ligne verticale rouge marque le début du réseau RES. Ligne noire continue : nombre cumulé. |
| In the text | |
|
Fig. 4 Magnitude (MLLDG) of earthquakes as a function of time from 1963 to 2023 within 110 km of Cigéo site. The red vertical line mark the start of the RES network. Magnitude (MLLDG) des séismes en fonction du temps entre 1963 et 2023 dans un rayon de 110 km autour du site Cigéo. La ligne verticale rouge marque le début du réseau RES. |
| In the text | |
|
Fig. 5 Magnitude (MLLDG) of earthquakes as a function of time from 1963 to 2023 within 90 km of Cigéo site. The red vertical line mark the start of the RES network. Magnitude (MLLDG) des séismes en fonction du temps entre 1963 et 2023 dans un rayon de 90 km autour du site Cigéo La ligne verticale rouge marque le début du réseau RES. |
| In the text | |
|
Fig. 6 Located quarry blasts 2002-2023 (black crosses) and exact quarry locations (white squares). Red squares mark quarries for which the blasts are not located anymore since 2004. Dark blue triangles: Epos-France (1962) stations. Light blue triangles: CEA stations. Black dots mark RES stations. White crosses correspond to closed stations in 2025. Pink circle indicates Cigéo site. French departments are delineated in dark grey. Black lines shows major and important seismic faults from BDFA database (Jomard et al., 2017). Tirs de carrière localisés entre 2002 et 2023 (croix noires) and position exacte des carrières (carrés blancs). Les carrés rouges indiquent les carrières pour lesquelles les tirs ne sont plus localisés depuis 2004. Triangles bleus foncés : stations Epos-France (1962). Triangles bleus clairs : stations CEA. Points noirs : stations RES. Croix blanches : stations fermées en 2025. Le cercle rose indique le site de Cigéo. Les départements français sont délimités en gris foncé. Les lignes noires représentent les principales failles sismiques issues de la base de données BDFA (Jomard et al., 2017). |
| In the text | |
|
Fig. 7 Number of annual suspected induced earthquakes. Nombre annuel de séismes supposés induits. |
| In the text | |
|
Fig. 8 Gutenberg-Richter distribution for 1963-2001 (blue) and 2002-2023 (red) periods. Both periods span over 22 years. Distribution de Gutenberg-Richter pour les périodes 1963-2001 (bleu) et 2002-2023 (rouge). Les deux périodes couvrent chacune 22 ans. |
| In the text | |
|
Fig. 9 Normalized cumulative distribution of the number of phases used for epicenter location for 1963-2001 (blue) and 2002-2023 (red) periods. Distribution cumulée normalisée du nombre de phases utilisées pour la localisation de l’épicentre pour les périodes 1963-2001 (bleu) et 2002-2023 (rouge). |
| In the text | |
|
Fig. 10 Normalized cumulative distribution of the length of the semi major axis of the 68% confidence ellipse of epicentre locations for 1963-2001 (blue) and 2002-2023 (red) periods. Distribution cumulée normalisée de la longueur du demi-grand axe de l’ellipse de confiance à 68% des localisations d’épicentres pour les périodes 1963-2001 (bleu) et 2002-2023 (rouge). |
| In the text | |
|
Fig. 11 Normalized cumulative distribution of the primary (solid line) and secondary (dashed line) azimuthal gaps of epicenter locations for 1963-2001 (blue) and 2002-2023 (red) periods. Distribution cumulée normalisée des gaps azimutaux primaires (ligne continue) et secondaires (ligne pointillée) des localisations d’épicentres pour les périodes 1963-2001 (bleu) et 2002-2023 (rouge). |
| In the text | |
|
Fig. 12 Cumulative distribution of the length of semi-great axis of the 68% confidence ellipse determined by iLoc after relocation. Distribution cumulée de la longueur du demi-grand axe de l’ellipse de confiance à 90% déterminée par iLoc après relocalisation. |
| In the text | |
|
Fig. 13 Cumulative distribution of the distance between the epicenters determined by iLoc and locgse. Distribution cumulée de la distance entre les épicentres déterminés par iLoc et locgse. |
| In the text | |
|
Fig. 14 Difference between the hypocentral depths determined by iLoc and locgse. Différence entre les profondeurs hypocentrales déterminées par iLoc et locgse. |
| In the text | |
Current usage metrics show cumulative count of Article Views (full-text article views including HTML views, PDF and ePub downloads, according to the available data) and Abstracts Views on Vision4Press platform.
Data correspond to usage on the plateform after 2015. The current usage metrics is available 48-96 hours after online publication and is updated daily on week days.
Initial download of the metrics may take a while.