")
")
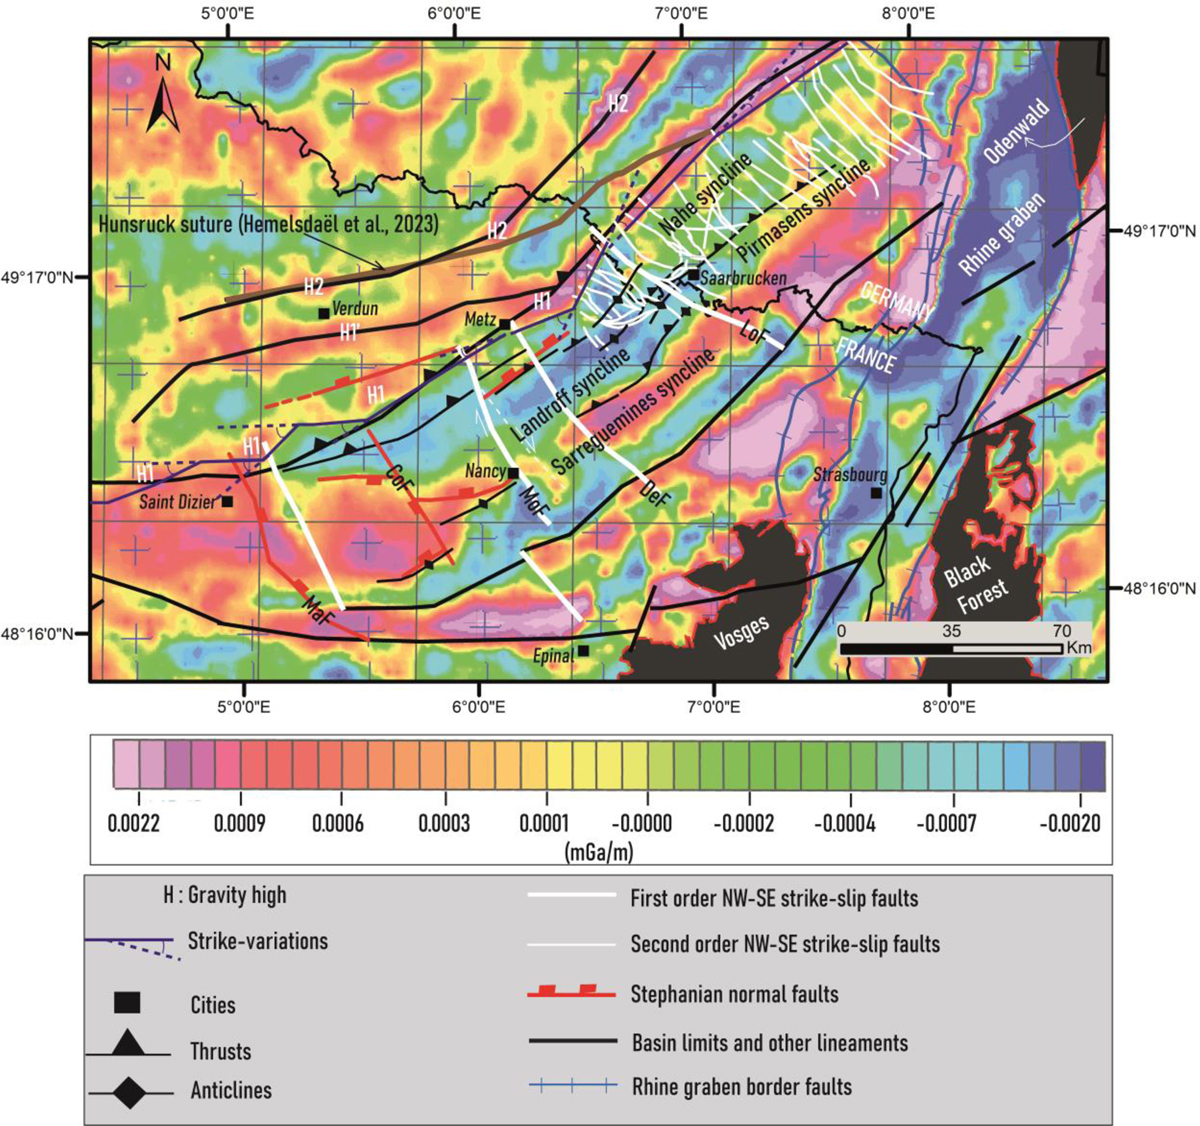
Fig. 5
Download original image
Map of the first vertical derivative highlighting the geometry of the MHFZ. Note the different abrupt changes of the MHFZ orientation from the SNCB to the LCB. The map is projected with the Lambert 93 system. The vertical and horizontal represent the grid used to compute the map and not the longitude and latitude lines. The later are represented by the cross visible on the map.
Current usage metrics show cumulative count of Article Views (full-text article views including HTML views, PDF and ePub downloads, according to the available data) and Abstracts Views on Vision4Press platform.
Data correspond to usage on the plateform after 2015. The current usage metrics is available 48-96 hours after online publication and is updated daily on week days.
Initial download of the metrics may take a while.