")
")
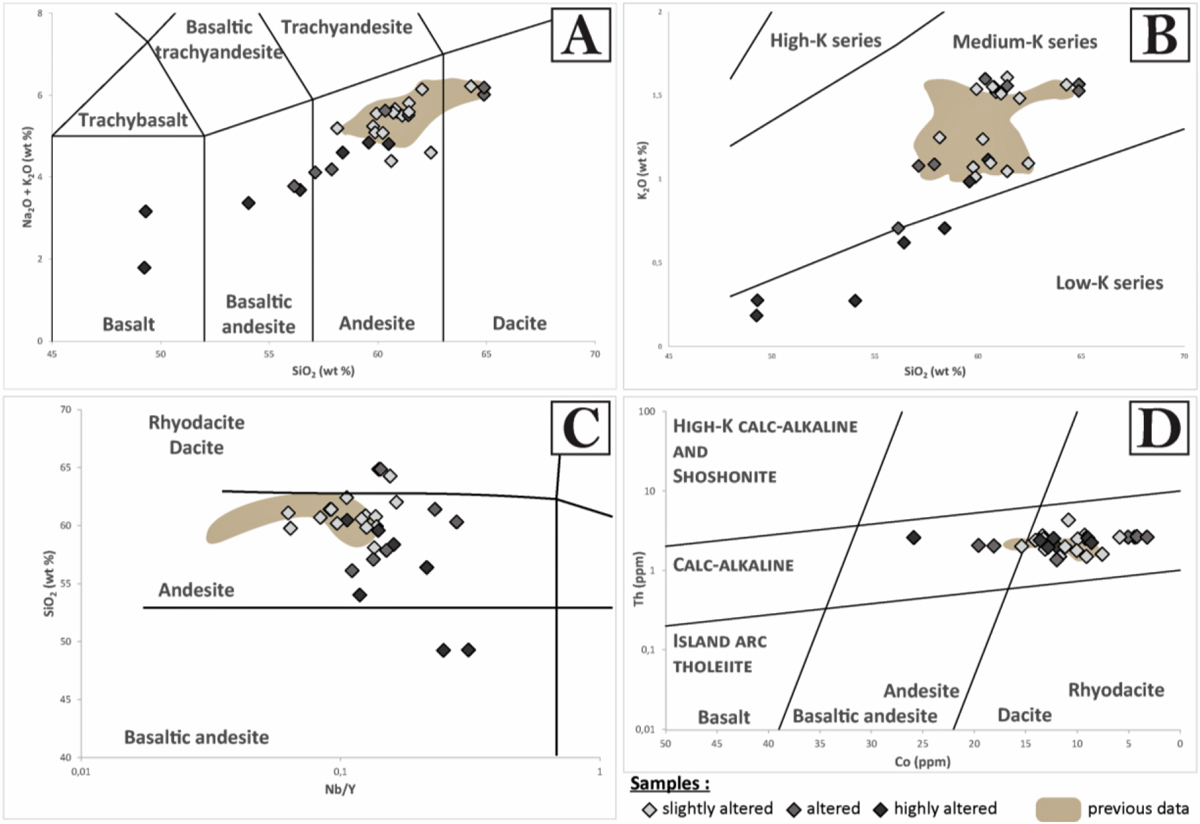
Fig. 3
Download original image
Geochemical characterization of lava flows. A: Total alkali vs. silica diagram after Bas et al. (1986), previous data from: Samper et al. (2007), Ricci et al. (2017) and Navelot et al. (2018); B: SiO2 vs. K2O plot after Peccerillo and Taylor (1976), previous data from Samper et al. (2007, 2009), Ricci et al. (2017) and Navelot et al. (2018); C: SiO2 vs. Nb/Y diagram after Winchester and Floyd (1977), previous data from Ricci et al. (2017); D: Co vs. Th plot after Hastie et al. (2007), previous data from Ricci et al. (2017).
Current usage metrics show cumulative count of Article Views (full-text article views including HTML views, PDF and ePub downloads, according to the available data) and Abstracts Views on Vision4Press platform.
Data correspond to usage on the plateform after 2015. The current usage metrics is available 48-96 hours after online publication and is updated daily on week days.
Initial download of the metrics may take a while.