")
")
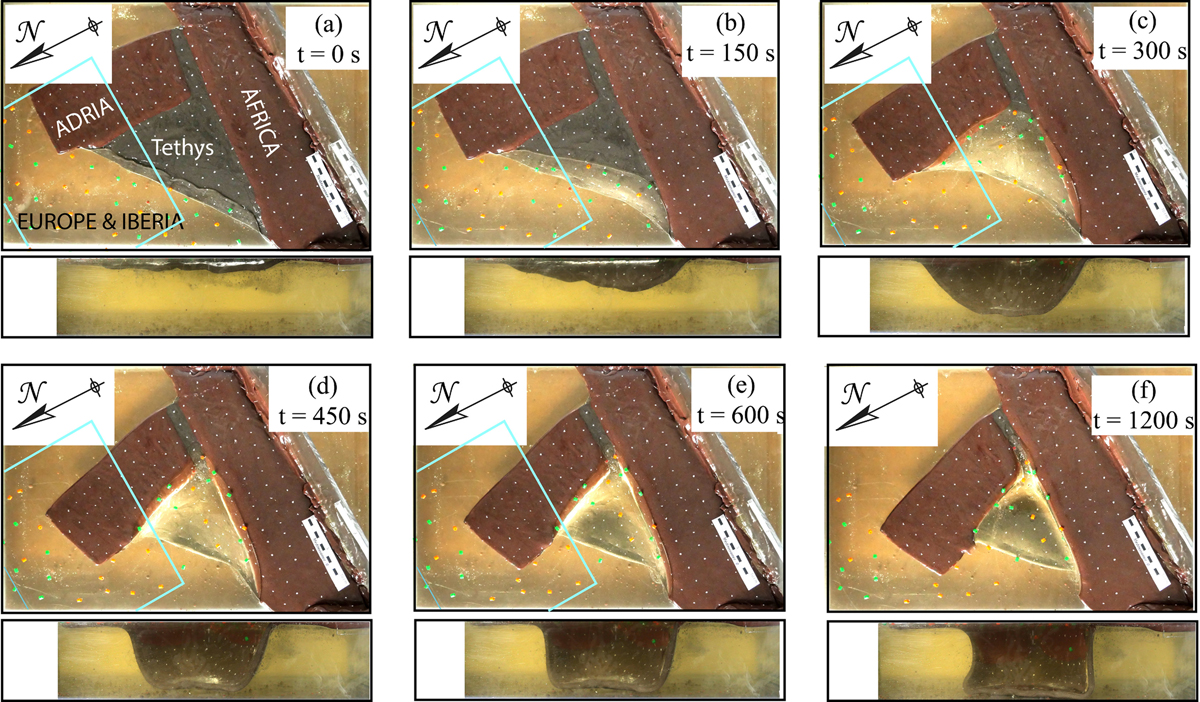
Fig. 2
Download original image
Top and lateral views of Model 1. The red silicone is buoyant and models continental lithosphere. In contrast, the buoyancy of the black silicone modeling oceanic lithosphere is negative. (a) beginning of experiment, the oceanic plate has just been forced downward in the upper mantle to initiate subduction; (b) and (c) after 150 and 300 s of experiment, respectively: the process of subduction is accelerating and Adria initiates counterclockwise rotation; (d), (e) and (f) after 450, 600 and 1200 s, respectively: the oceanic plate deposits above in the lower mantle (bottom of the box), and the dip of the slab increases, further increasing the rotation of Adria. Floating colored plastic beads show surface flow in the glucose syrup. Blue rectangles show the domain for which the principal axes of the strain tensor is presented in Figure 4.
Current usage metrics show cumulative count of Article Views (full-text article views including HTML views, PDF and ePub downloads, according to the available data) and Abstracts Views on Vision4Press platform.
Data correspond to usage on the plateform after 2015. The current usage metrics is available 48-96 hours after online publication and is updated daily on week days.
Initial download of the metrics may take a while.