")
")
Fig. 2
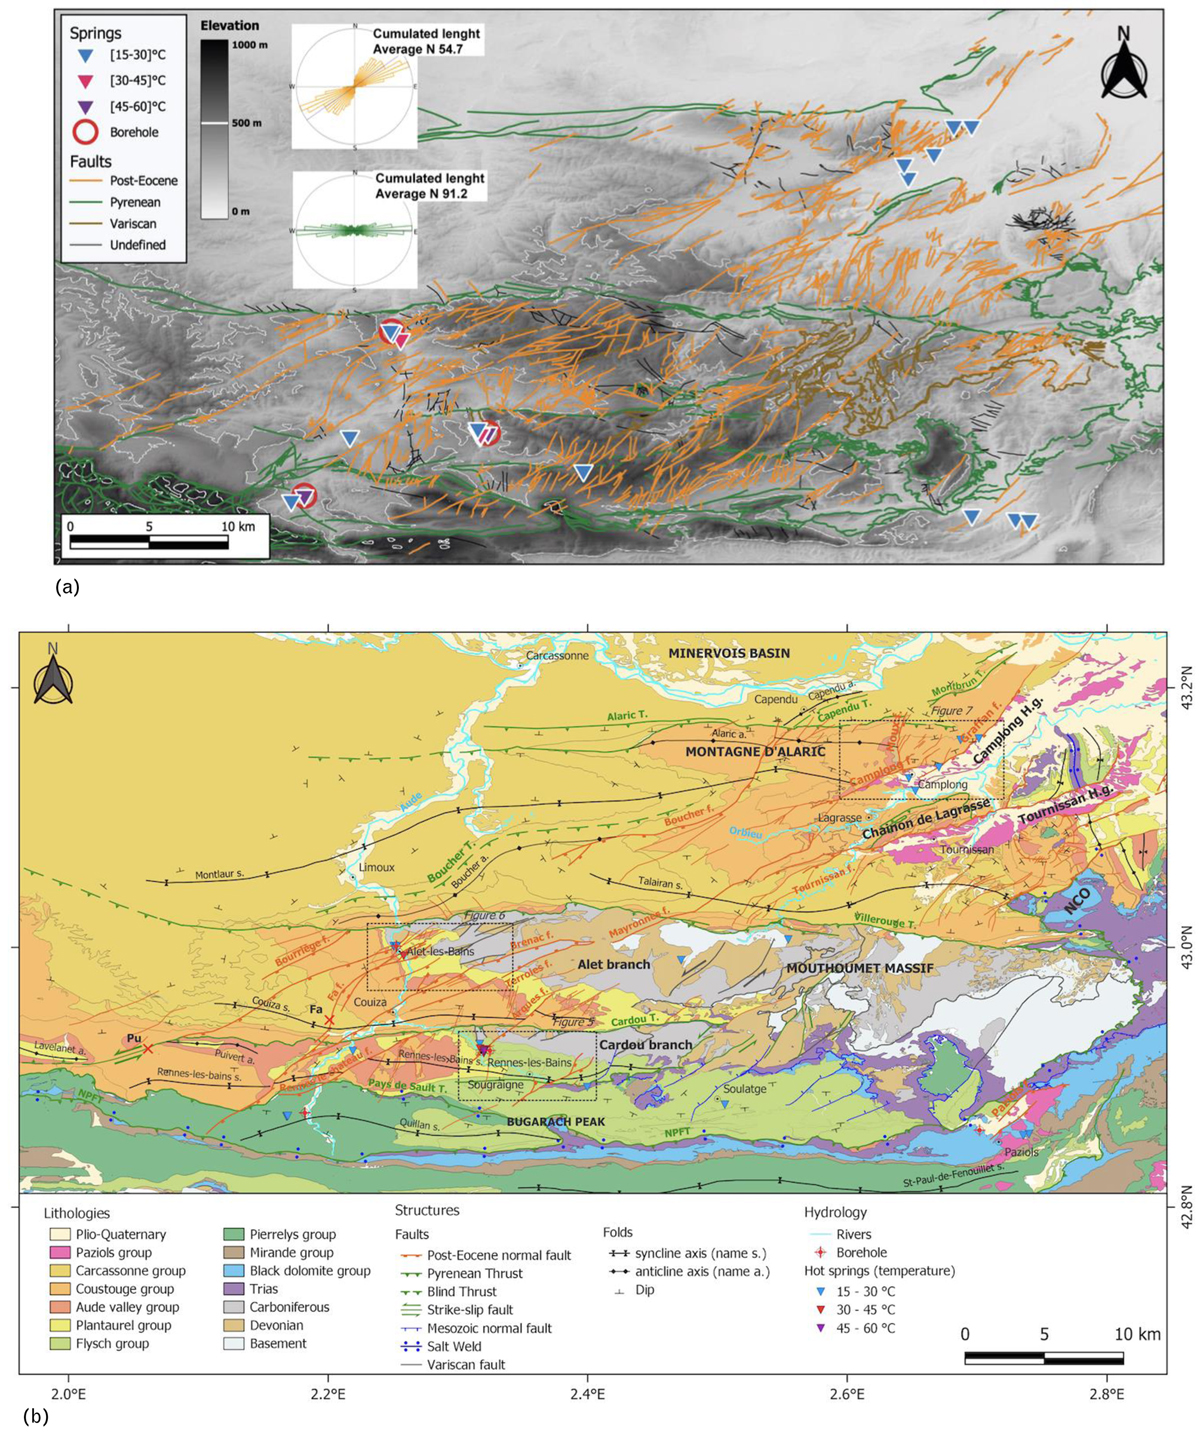
Download original image
a. Digital Elevation Model (SRTM 30m) with statistical mean direction of each faults network based on relative chronology (Pyrenean faults in green, mean direction N91.2°E; Post-Eocene faults in orange, N54.7°E) and the location hotsprings (>15 °C). b. Geological map of the Corbières region using chronostratigraphic chart (groups) described in Figures 3 and 4 after BRGM map (Bessière et al., 1977a; Souquet et al., 1984; Ellenberger et al., 1985; Crochet et al., 1989; Berger, 1990; Berger et al., 1993; 1997) and BRGM memoir (Bessière et al., 1977b; 1989; Ellenberger et al., 1987; Bilotte et al., 1988; Berger et al., 1990; 1993; 1997). Faults are colored by their last motion age (relative chronological mapping, field-work of this study and literature). Black dotted squares correspond to detailed geological maps of Figures 5–7. Hydrogeological mapping from BRGM books and memoirs (Pomerol and Ricour, 1992; Aunay and Le Strat, 2002; Elbaraka et al., 2010; Yvroux, 2012). Hotsprings are represented by triangles colored by temperatures and the boreholes pumping thermal waters are also indicated (Tab. 1). NCO : Nappe des Corbières Orientales.
Current usage metrics show cumulative count of Article Views (full-text article views including HTML views, PDF and ePub downloads, according to the available data) and Abstracts Views on Vision4Press platform.
Data correspond to usage on the plateform after 2015. The current usage metrics is available 48-96 hours after online publication and is updated daily on week days.
Initial download of the metrics may take a while.