")
")
Fig. 10
Download original image
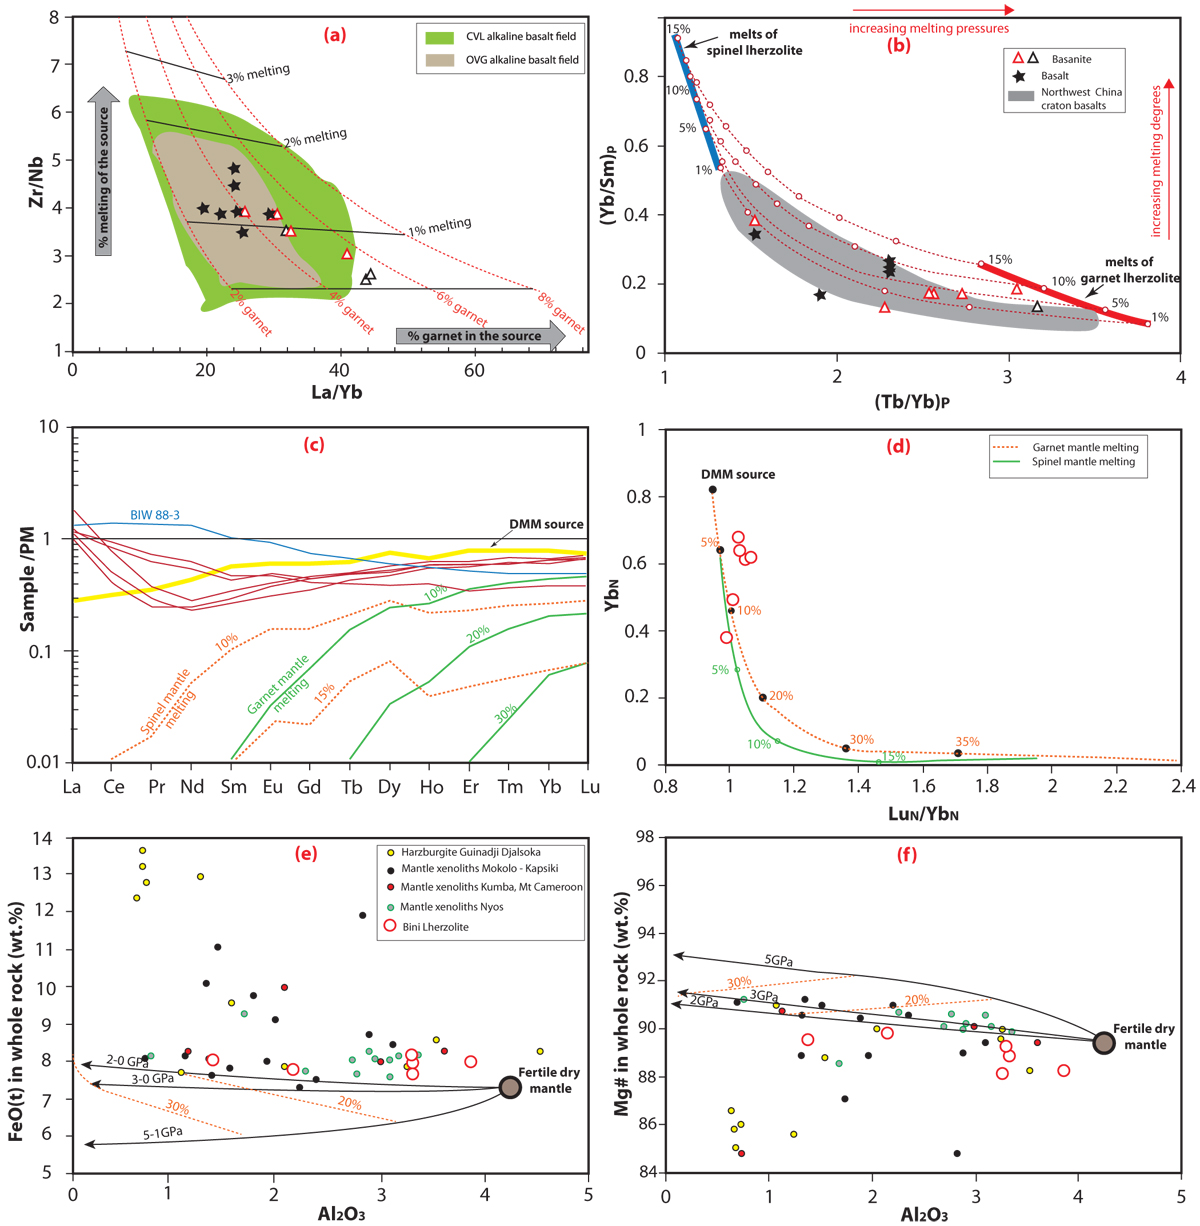
Covariation diagrams of major, trace, and rare earth elements. (a) Modeled melting (Zr/Nb versus La/Yb) results for the studied mafic lavas together with other mafic lavas with MgO>4 from the OVG and CVL. Melts that produced most basanites and alkali basalts were produced by <2% partial melting of a dominantly garnet (<6%) bearing mantle lherzolite. (b) Estimate of the melting degrees of the Bini mafic lavas, given a fertile lherzolite source with primitive mantle-like trace-element contents (McDonough and Sun, 1995). The dashed red lines designate the mixing paths of aggregated fractional partial melts from garnet- and spinel-facies lherzolites at the fixed melting degrees (1%, 5%, 10%, 15%). Partition coefficients are taken from Bédard (2006) for olivine, orthopyroxene, clinopyroxene, and spinel and from Adam and Green (2006) for garnet. In black color are samples from Tiabou et al. (2019). (c) Primitive mantle (McDonough and Sun, 1995) normalized REE for the Bini lherzolites. The trace element modeling results for mantle melting in spinel and garnet stability fields of a fertile mantle source and that of the depleted MORB mantle source (DMM) (Workman and Hart, 2005) (modeling of Doucet et al., 2023) are also shown. (d) LuN/YbN versus YbN for Bini lherzolites compared to melting models in the spinel stability field (green line) and garnet stability field (red dashed line). The primitive mantle values are from McDonough and Sun, 1995. Trace element modeling for a DMM source in spinel and garnet stability fields with garnet exhaustion after 20% of melting. (e) and (f) Whole rock Al2O3 versus Mg# and FeOt of the studied lherzolite together with other mantle xenoliths from northern Cameroon. The composition of Northwest China craton basalts is from Dai et al. (2024), and that of mantle xenoliths is from Nyos (Bilong et al., 2010; Teitchou et al., 2011); Kumba after Sababa et al. (2015); Mt. Cameroon after Wandji et al. (2009); Mokolo (ongoing work); Kapsiki after Tamen et al. (2015); and Guinnadji and Djalsoka after Adama et al. (2021). Thick black lines show the compositions for melting residue formed by isobaric batch melting of fertile mantle sources at 2, 3, and 5 GPa (Herzberg, 2004). Dashed red lines show polybaric melt extraction at 20% and 30% of melting.
Current usage metrics show cumulative count of Article Views (full-text article views including HTML views, PDF and ePub downloads, according to the available data) and Abstracts Views on Vision4Press platform.
Data correspond to usage on the plateform after 2015. The current usage metrics is available 48-96 hours after online publication and is updated daily on week days.
Initial download of the metrics may take a while.