")
")
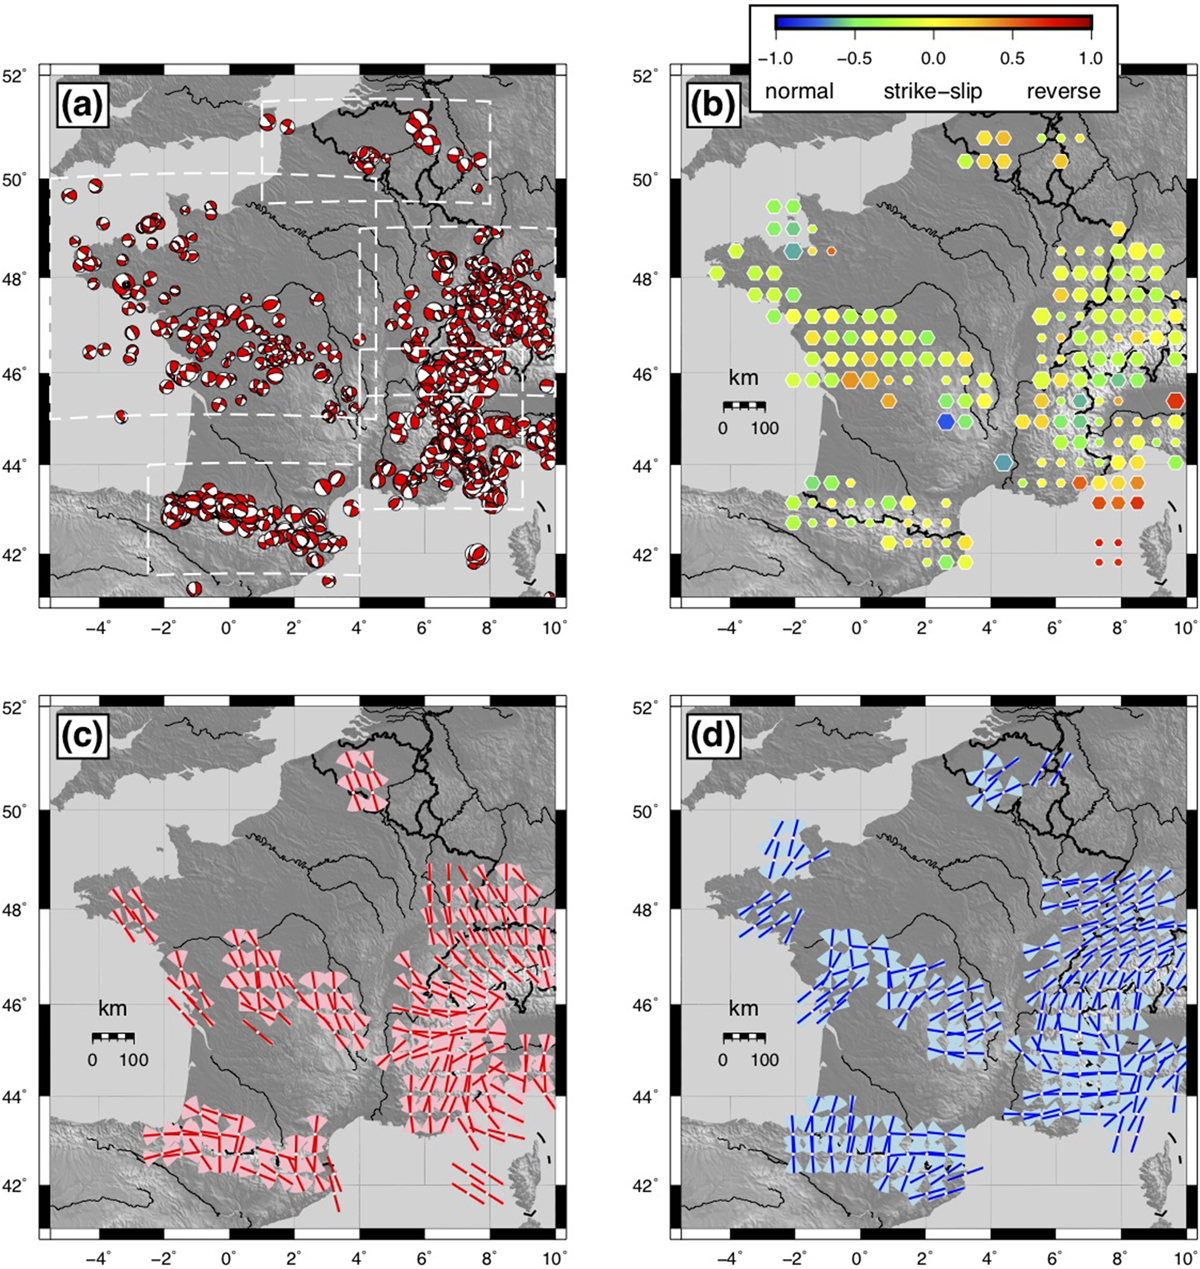
Fig. 4
Download original image
FMHex20 database for metropolitan France and neighboring regions. (a) Stereographic projections (lower hemisphere) of individual focal mechanisms. Symbol sizes are proportional to magnitudes. White dashed boxes show regional figures in Supplementary Material. (b) Grid-average faulting style. Blue (−1): normal, yellow (0): strike slip, red (1): reverse. Symbol sizes are inversely proportional to standard deviations s (large: σ ≤ 0.25, medium: 0.25 < σ ≤ 0.5, small: σ > 0.5). (c) and (d) Grid-average orientations of near-horizontal P (red) and T (blue) axes. Light-color fan shapes indicate standard deviations σ.
Current usage metrics show cumulative count of Article Views (full-text article views including HTML views, PDF and ePub downloads, according to the available data) and Abstracts Views on Vision4Press platform.
Data correspond to usage on the plateform after 2015. The current usage metrics is available 48-96 hours after online publication and is updated daily on week days.
Initial download of the metrics may take a while.