")
")
Fig. 18
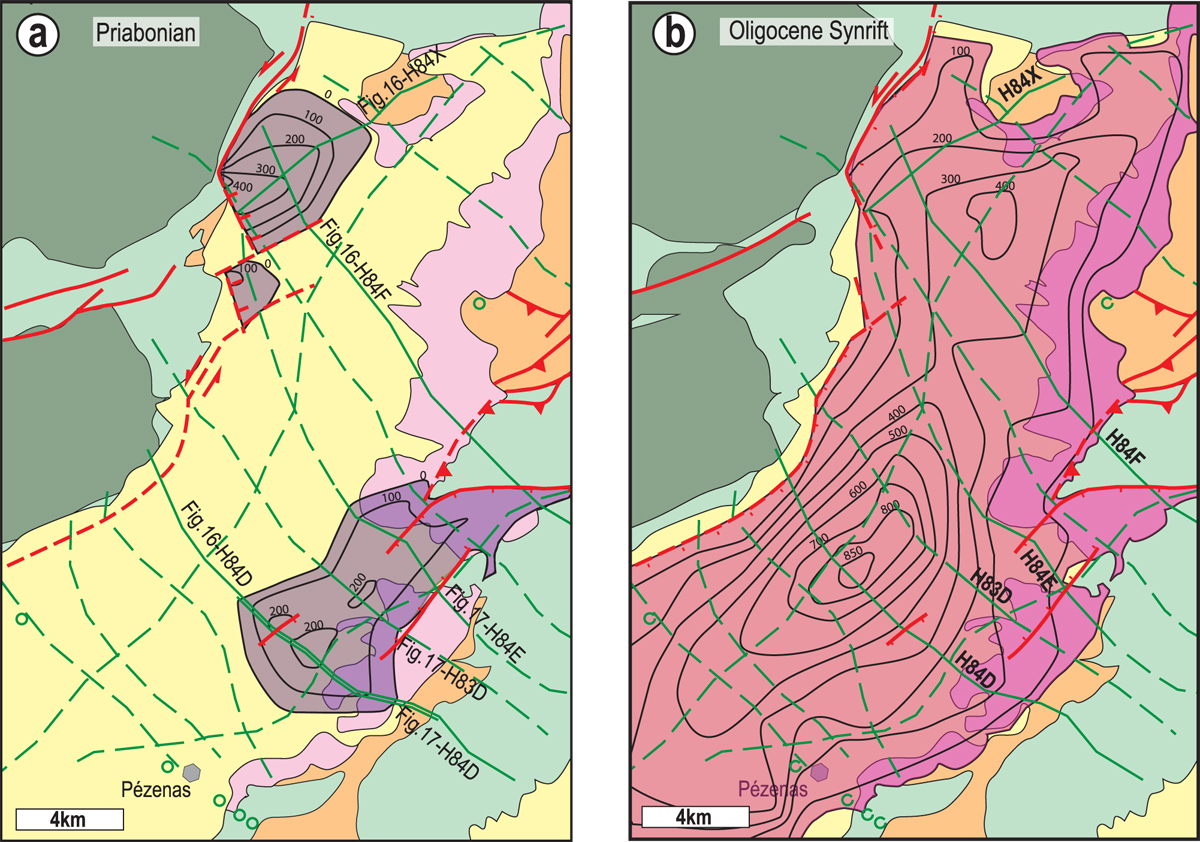
Download original image
Isopach maps of Priabonian (a) and of syn-rift (b) sequences in the Hérault basin, superimposed onto a simplified geological map (same legend as in Fig. 2, and location in Fig. 2). Contouring of depocenters in metres. The seismic profiles used in the study are represented in stippled green lines; plain green lines with labels correspond to the profiles shown in Figures 16 and 17. Faults are represented in red.
Current usage metrics show cumulative count of Article Views (full-text article views including HTML views, PDF and ePub downloads, according to the available data) and Abstracts Views on Vision4Press platform.
Data correspond to usage on the plateform after 2015. The current usage metrics is available 48-96 hours after online publication and is updated daily on week days.
Initial download of the metrics may take a while.