")
")
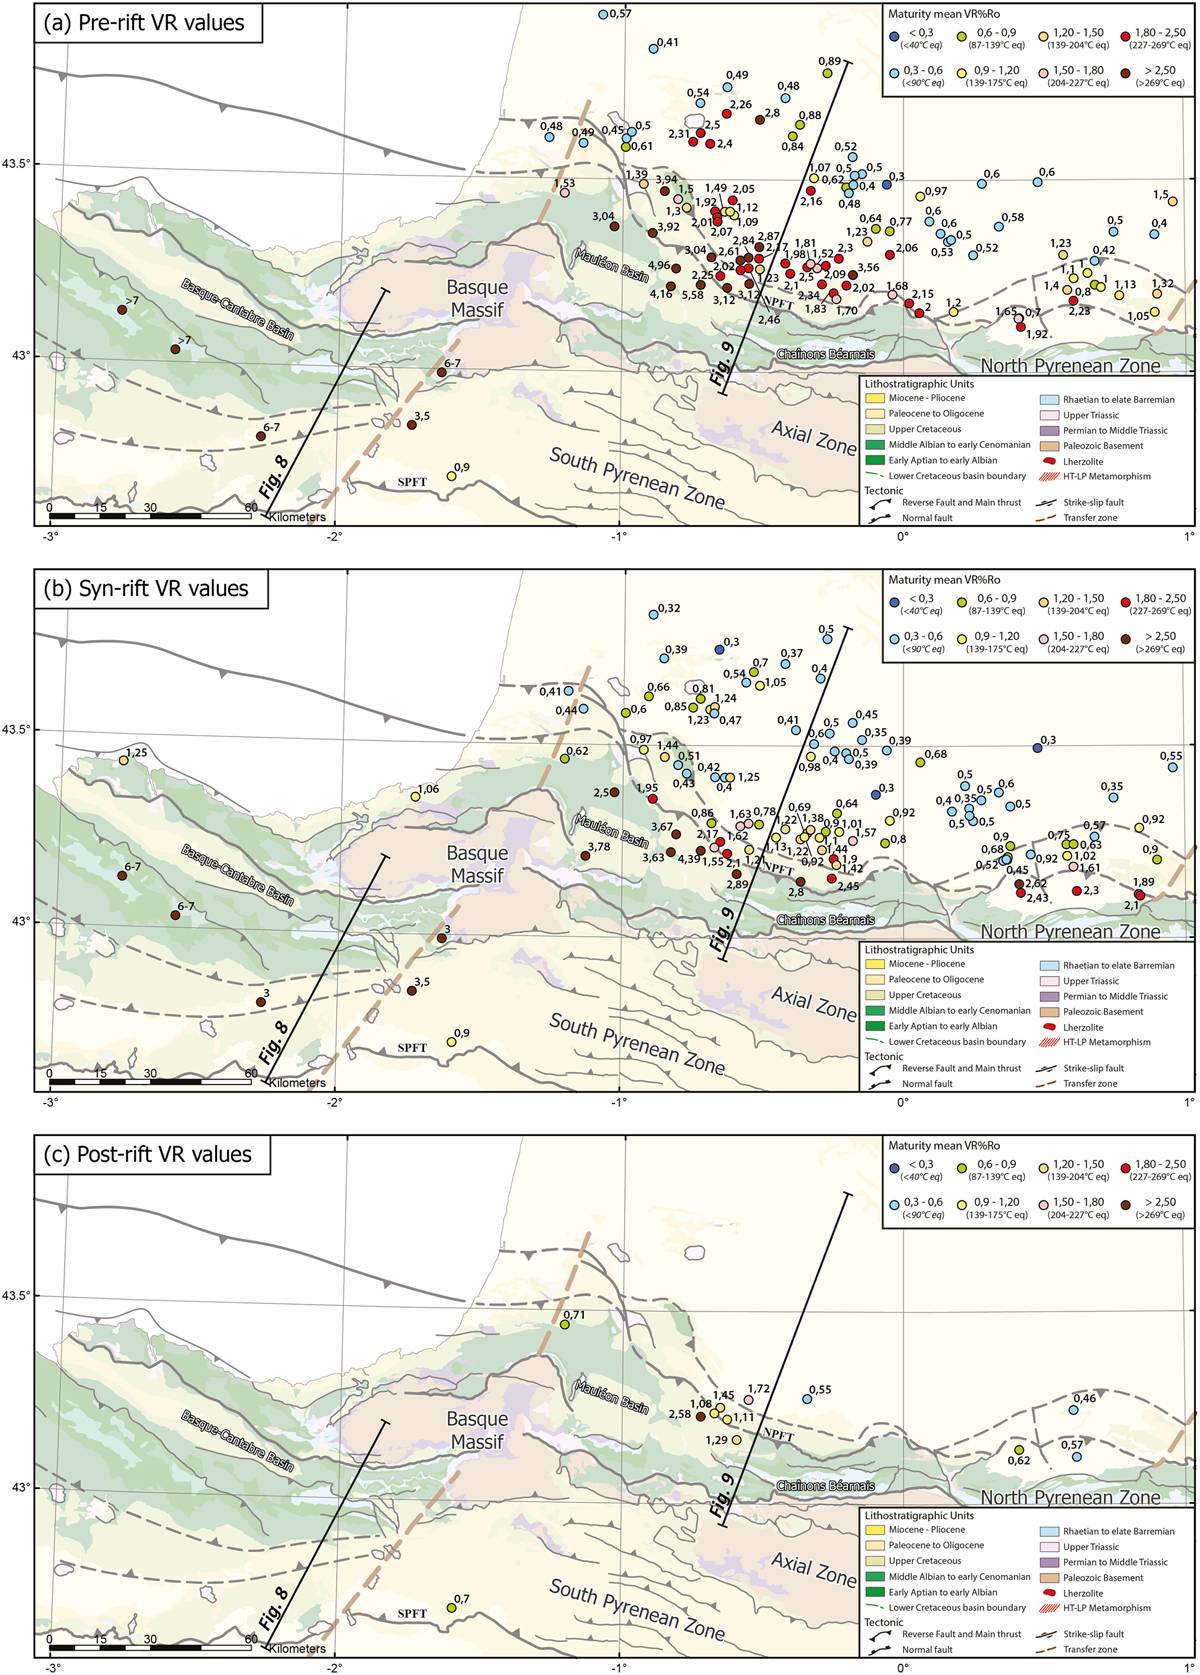
Fig. 3
Download original image
Maps displaying the spatial distribution of Ro data for each rift-related tectono-stratigraphic unit. (a) Average Ro values measured in pre-rift sediments (Triassic to Barremian). (b) Average Ro values measured in syn-rift sediments (Aptian to Cenomanian). (c) Average Ro values measured in post-rift sediments (Turonian to Coniacian).
Current usage metrics show cumulative count of Article Views (full-text article views including HTML views, PDF and ePub downloads, according to the available data) and Abstracts Views on Vision4Press platform.
Data correspond to usage on the plateform after 2015. The current usage metrics is available 48-96 hours after online publication and is updated daily on week days.
Initial download of the metrics may take a while.