")
")
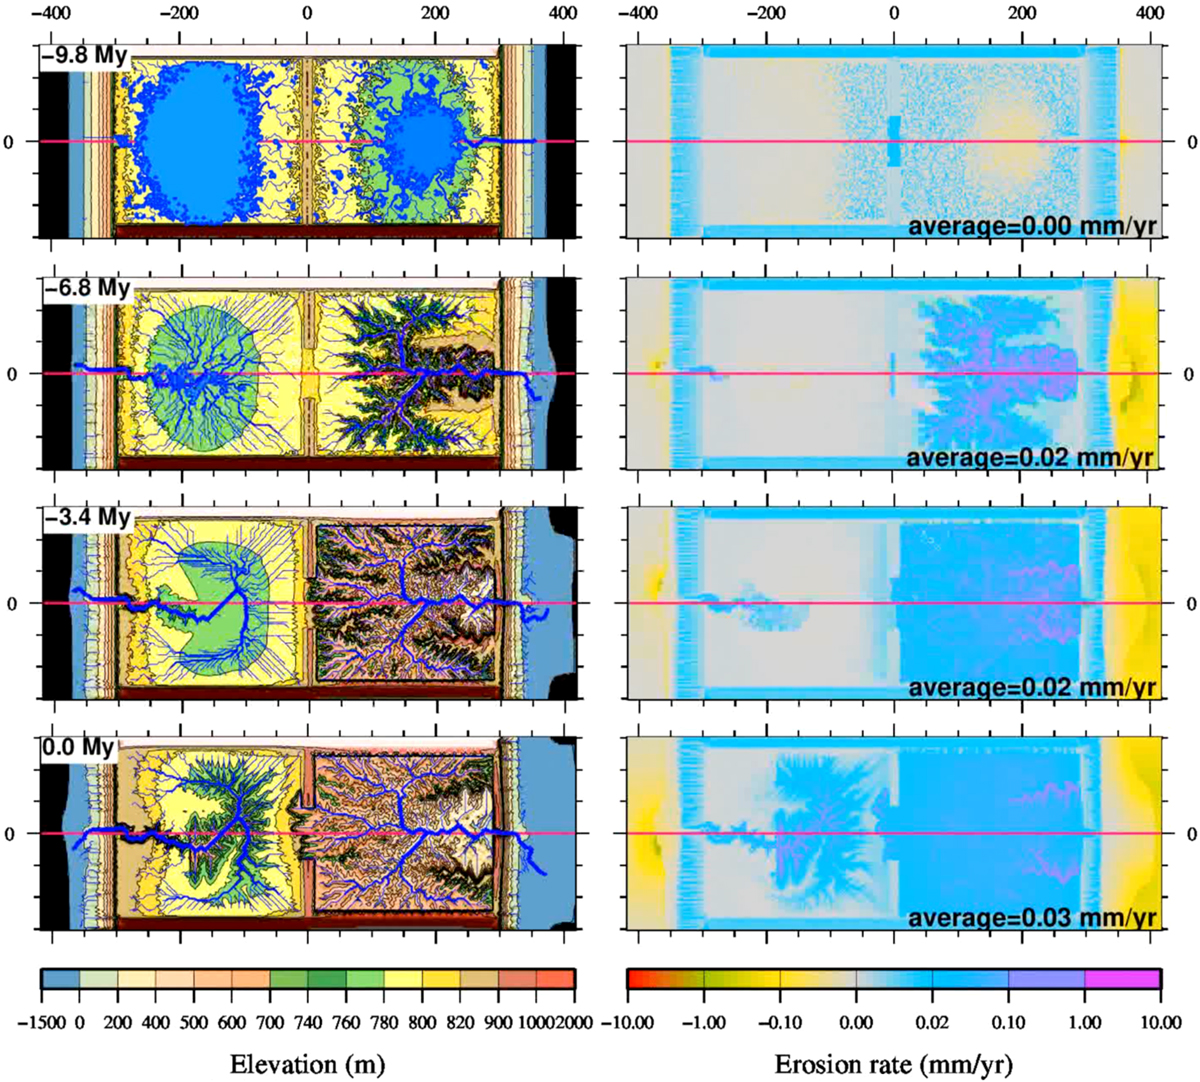
Fig. 2
Download original image
Four stages of the evolution of the reference model. Each stage shows the calculated elevation and drainage network (left) and the incision rate distribution (right). The horizontal red lines locate the sections in Figure 3. A video animation of this model can be accessed at https://youtu.be/nF0obRQWL60.
Current usage metrics show cumulative count of Article Views (full-text article views including HTML views, PDF and ePub downloads, according to the available data) and Abstracts Views on Vision4Press platform.
Data correspond to usage on the plateform after 2015. The current usage metrics is available 48-96 hours after online publication and is updated daily on week days.
Initial download of the metrics may take a while.