")
")
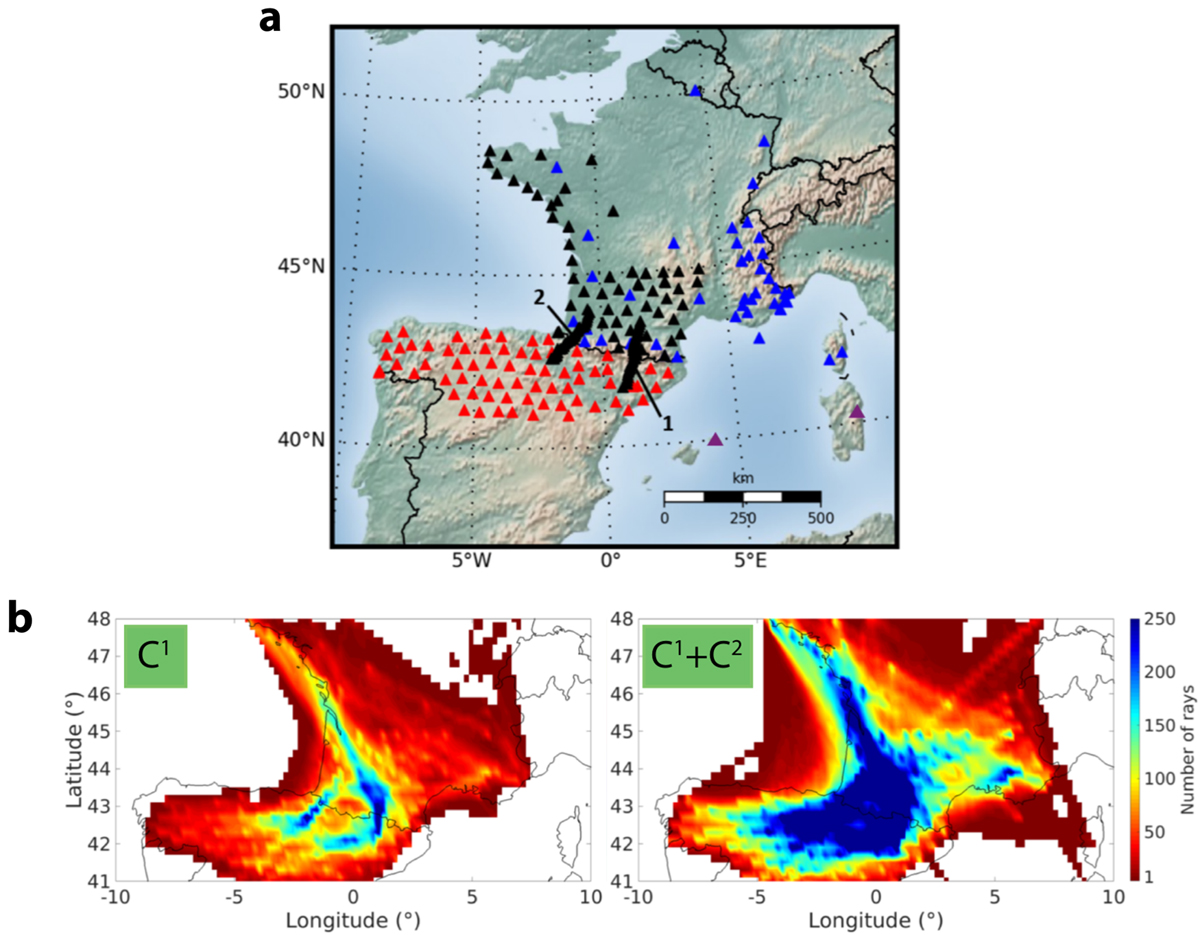
Fig. 7
Download original image
(a) Map of seismic stations used to image the Pyrénées using seismic noise correlations, including stations from permanent networks (blue triangles), the IberArray and PYROPE experiments (red and black triangles resp.). The two north-south PYROPE transects (black triangles) were not deployed simultaneously, it is therefore not possible to compute noise correlations between them. Nevertheless, it is possible to use an iterative correlation process (C2) to measure Rayleigh waves velocity between them. (b) Number of Rayleigh waves group velocity measurements, at 5 seconds of period, crossing each cell using only standard noise correlations (C1, left panel), and when using iterative correlations as well (C1 + C2, right panel).
Current usage metrics show cumulative count of Article Views (full-text article views including HTML views, PDF and ePub downloads, according to the available data) and Abstracts Views on Vision4Press platform.
Data correspond to usage on the plateform after 2015. The current usage metrics is available 48-96 hours after online publication and is updated daily on week days.
Initial download of the metrics may take a while.